

Google Analytics is a website analytics service designed to give you a clear picture of how your business performs online. If you use it, then you have access to a lot of data. However, you might not know how to get the most meaningful insights from this data. Here’s how in three simple steps:
1. Ensure the Quality of Your Google Analytics Data
The most meaningful insights a tour or activity provider can get from Google Analytics have to do with bookings and revenue. So, the best thing you can do to ensure the quality of your Google Analytics data is to make sure that you are sharing your online booking and revenue data with your Google Analytics account. This typically requires that you set up and enable Ecommerce Tracking on your Google Analytics account and add the e-commerce tracking code to your website pages.
At Xola, we know how important this is, so we have automated this data transfer with our Google Analytics Ecommerce integration. This integration adds revenue information to your Google Analytics account enabling you to see precisely how effective your site is at converting visitors into paying customers. With Xola’s Google Analytics Ecommerce integration you can easily access and analyze revenue by reservation, channel, and all the way down to tours booked or items purchased. This enables you to make informed, data-driven decisions that move your business forward.
Once you have all of your crucial information in Google Analytics, you’ll have an unfiltered view that includes website traffic generated by your staff, bots, spiders and other sources. Some of this data may cloud your view of the traffic that matters the most. So, creating a filtered view is the next best thing you can do to ensure the quality of your Google Analytics data. There are several types of filters you can consider using including:
- Exclude internal traffic – You can filter out all traffic coming from your business’s IP address so that your internal web traffic won’t distort your analytics reports. This is especially important if your employees use your website a lot.
- Exclude known bots and spiders – Go into Google Analytics and click “Admin,” then “View Settings.” Scroll down and check the box that says “Exclude all hits from known bots and spiders.” This way, search crawlers, and other automated web visiting tools will not impact your analytics.
- Learn to identify and block new bots and spiders – New bots and spiders can infiltrate your Google Analytics any day. To get the skills to deal with it yourself, read this in-depth guide to removing referrer spam.
With e-commerce data in your Google Analytics account, and the traffic from staff, bots and spiders out of your filtered view, you’ll be ready to get some solid insights.
2. Define the Questions that You Want to Answer
The data you really need from Google Analytics in any given week or month will only be a small fraction of what’s there for you to review. So, you want to define your questions very well and then understand how to use Google Analytics to answer those questions.
To get you started, here are 8 revenue-driven questions that you may want to ask and detailed instructions on how to answer them with Google Analytics:
- What is my revenue from online bookings?
- What is my revenue by customer type (veterans, minors, etc.)?
- What is my revenue by type of offering, such as core, add-on, and gift offerings?
- What is my revenue by marketing channel, such as paid search, organic search, social, and direct?
- How much value is driven by each page on my website?
- What percentage of visits to my site result in a booking?
- What is my conversion rate by marketing channel?
- What is my conversion rate by landing page?
If you have additional questions that you want to ask, do some research to find out how they can be answered with Google Analytics. For some questions, you’ll be able to answer them with reports that come out of the box. For other questions, you may need to do something a little more advanced like build new segments in Google Analytics.
3. Set Up a Dashboard
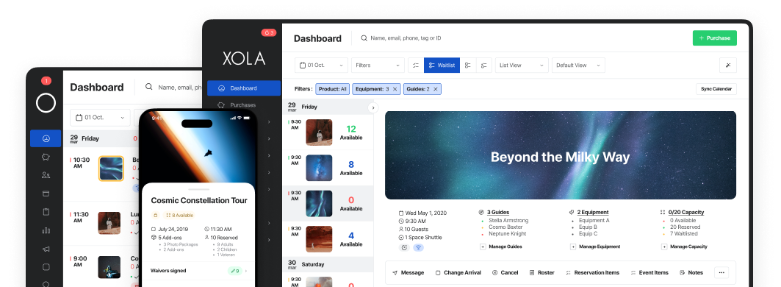
A dashboard makes it easy for you to quickly review, on a regular basis, the data from Google Analytics that answers your most pressing questions. To set up a dashboard, you can create one in Google Analytics or you can leverage a dashboard that Xola has already customized to the needs of tour and activity businesses.
Google Analytics includes a “My Dashboard” feature, which uses widgets to surface data from underlying reports. This Dashboard has a default view, but you can surface even more useful data by customizing it.
Your other option is to use Xola’s pre-built dashboard for Google Analytics, which showcases our favorite revenue-driven metrics. If you are a Xola customer and would like to get access to this dashboard, reach out to support@xola.com. If you are not a customer and would like to learn more, contact us at join@xola.com.
Conclusion
It’s easy to get meaningful insights from Google Analytics. All you have to do is ensure the quality of your Google Analytics data, define the questions that you want to answer, and then set up a dashboard where you can see all the data that answers your questions. Check your dashboard on a regular basis and adjust your business decisions to improve your metrics month-by-month and year-by-year. Pretty soon, your online revenue will be growing, you’ll be very efficient in how you review your Google Analytics data, and you’ll have greater confidence in your decisions.