For aspiring escape room owners, it’s important to ask: is there too much competition in my area? Is the market saturated?
(The short answer? it depends.)
To help answer such an important question, we got to work collecting, organizing, and analyzing the data to give aspiring escape room owners a clear look at the competitive landscape, state by state.
Calculating Escape Room “Density”
To understand the competitive landscape in each state, we couldn’t just compare the number of escape room locations by state. California, for example, has nearly forty million residents. Wyoming, on the other hand, has little more than five hundred thousand residents. Comparing the number of escape room locations in California and Wyoming would not reflect the dramatic differences in market size.
To account for different population sizes, we chose to model the competitive landscape by calculating the number of escape room locations per capita in the United States. We refer to this as the “escape room density rate”.
To create our model, we used the Room Escape Artist (REA) Directory to measured the number of escape room locations in each state. We then compared that number to 2017 population estimates provided by the US Census Bureau. Finally, we calculated the number of escape rooms per capita in each state using the following equation:
Escape Room Density = # of Escape Room Locations / Population x 100,000 Residents*
*We represented the density rate in terms of location per 100,000 Residents to make the final numbers more readily understandable.
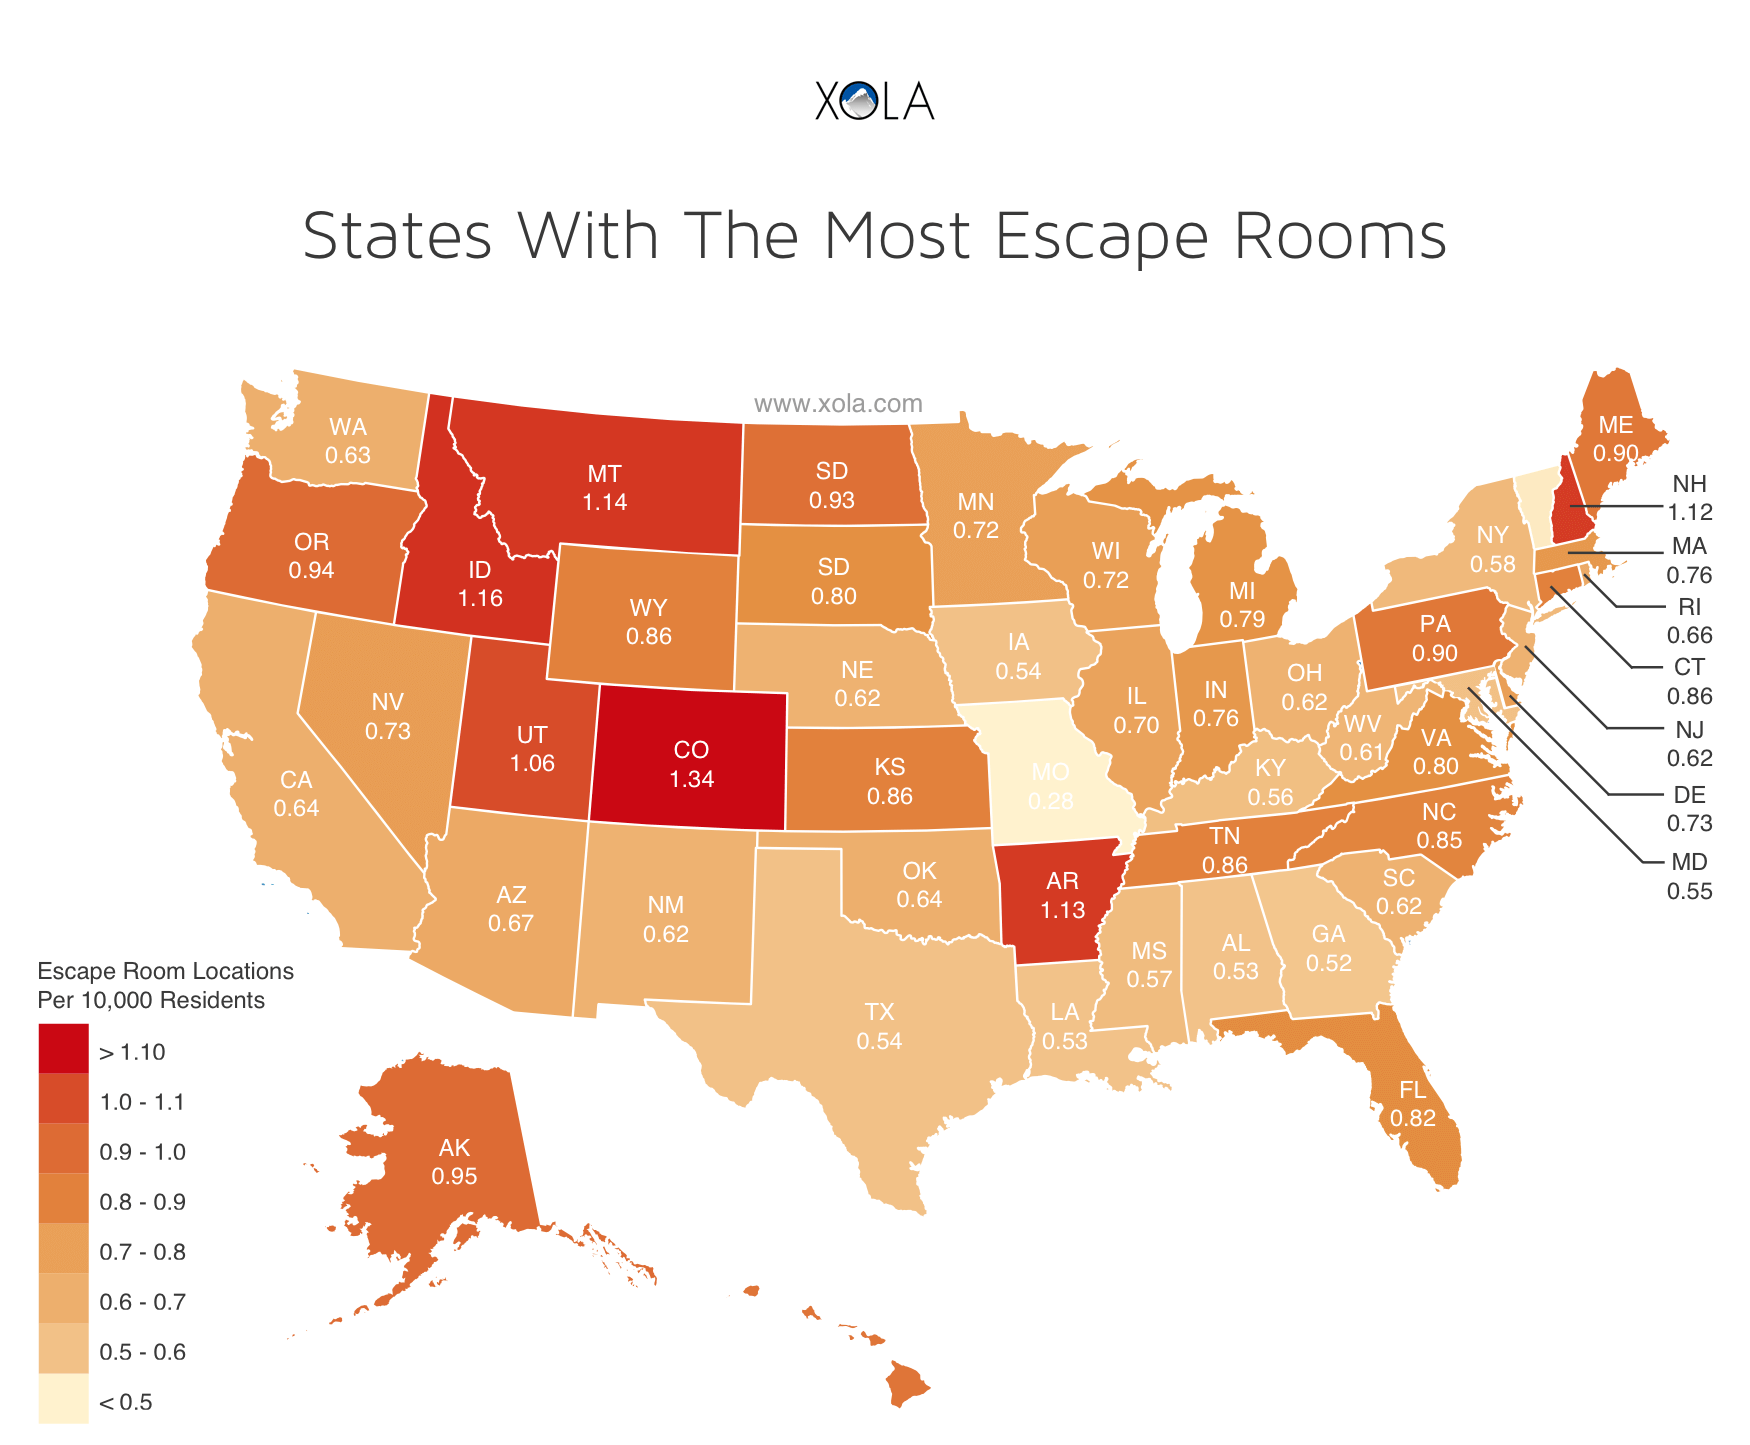
Finally, we visualized the data in a heatmap, with darker red states representing a higher number of escape rooms compared to the population, and light orange and yellow states representing a lower number.
The Results
Escape Room Density by State
The results of our analysis revealed some interesting insights.
As expected, we found that comparing the sheer number of locations in a given state is a bad indicator of the competitive landscape.
For example, Texas has 153 locations in the state, but has the 7th lowest escape room density rate. On the other hand, the District of Columbia has only 9 escape room locations in the state but has the second highest escape room density rate.
These examples serve as a reminder that, just because a state, city, or locale has a high number of escape rooms in the area, doesn’t mean that the local market is highly competitive or oversaturated. Locations with larger populations may still provide good business opportunities for new escape rooms.
On the other hand, a low number of escape rooms in an area does not necessarily mean that the market conditions are good (in fact, it may indicate just the opposite).
Instead of focusing on the absolute number of escape rooms in a given area, we recommend that aspiring escape room owners calculate their local “density rate” by comparing the number of escape room locations to local population estimates.
By comparing your local density rate to other areas with more (or less) favorable market conditions, you can more accurately assess the feasibility of your escape room business plan. For example, Arkansas and Nevada have similar population sizes. However, the number of escape rooms per capita in Nevada is lower than Arkansas, meaning a less competitive market.
2018 US Escape Room Density by State (Table)
| State | Escape Room Locations | 2017 Residents (US Census) | Escape Room Locations per 100,000 Residents |
| Colorado | 75 | 5,607,154 | 1.34 |
| District of Columbia | 9 | 693,972 | 1.30 |
| Idaho | 20 | 1,716,943 | 1.16 |
| Montana | 12 | 1,050,493 | 1.14 |
| Arkansas | 34 | 3,004,279 | 1.13 |
| New Hampshire | 15 | 1,342,795 | 1.12 |
| Utah | 33 | 3,101,833 | 1.06 |
| Alaska | 7 | 739,795 | 0.95 |
| Oregon | 39 | 4,142,776 | 0.94 |
| North Dakota | 7 | 755,393 | 0.93 |
| Hawaii | 13 | 1,427,538 | 0.91 |
| Maine | 12 | 1,335,907 | 0.90 |
| Pennsylvania | 115 | 12,805,537 | 0.90 |
| Connecticut | 31 | 3,588,184 | 0.86 |
| Tennessee | 58 | 6,715,984 | 0.86 |
| Wyoming | 5 | 579,315 | 0.86 |
| Kansas | 25 | 2,913,123 | 0.86 |
| North Carolina | 87 | 10,273,419 | 0.85 |
| Florida | 172 | 20,984,400 | 0.82 |
| South Dakota | 7 | 869,666 | 0.80 |
| Virginia | 68 | 8,470,020 | 0.80 |
| Michigan | 79 | 9,962,311 | 0.79 |
| Indiana | 51 | 6,666,818 | 0.76 |
| Massachusetts | 52 | 6,859,819 | 0.76 |
| Nevada | 22 | 2,998,039 | 0.73 |
| Delaware | 7 | 961,939 | 0.73 |
| Wisconsin | 42 | 5,795,483 | 0.72 |
| Minnesota | 40 | 5,576,606 | 0.72 |
| Illinois | 90 | 12,802,023 | 0.70 |
| Arizona | 47 | 7,016,270 | 0.67 |
| Rhode Island | 7 | 1,059,639 | 0.66 |
| California | 252 | 39,536,653 | 0.64 |
| Oklahoma | 25 | 3,930,864 | 0.64 |
| Washington | 47 | 7,405,743 | 0.63 |
| Nebraska | 12 | 1,920,076 | 0.62 |
| New Mexico | 13 | 2,088,070 | 0.62 |
| New Jersey | 56 | 9,005,644 | 0.62 |
| Ohio | 72 | 11,658,609 | 0.62 |
| South Carolina | 31 | 5,024,369 | 0.62 |
| West Virginia | 11 | 1,815,857 | 0.61 |
| New York | 116 | 19,849,399 | 0.58 |
| Mississippi | 17 | 2,984,100 | 0.57 |
| Kentucky | 25 | 4,454,189 | 0.56 |
| Maryland | 33 | 6,052,177 | 0.55 |
| Texas | 153 | 28,304,596 | 0.54 |
| Iowa | 17 | 3,145,711 | 0.54 |
| Louisiana | 25 | 4,684,333 | 0.53 |
| Alabama | 26 | 4,874,747 | 0.53 |
| Georgia | 54 | 10,429,379 | 0.52 |
| Vermont | 2 | 623,657 | 0.32 |
| Missouri | 17 | 6,113,532 | 0.28 |
Methodology
To model the competitive landscape of escape rooms in the United States, we needed an accurate database of local escape rooms in each state. We chose the Room Escape Artist (REA) Directory of escape room locations list to run our analysis due to the coverage and quality of the data provided.
It is important to note that our calculation were made based on the number of escape room locations, not business entities. A business with 5 locations, for example, will be counted 5 times.
We then compared the number of escape room locations to 2017 population estimates provided by the US Census Bureau.
Assessing Local Market Conditions
When assessing the competitive landscape of your own locale, there are a few other factors you should consider adding to your analysis for a more accurate picture of the local market opportunity.
Competition Happens at the Local Level
For most escape room businesses, competition happens at the regional, city, or even neighborhood level. When analyzing the market opportunity for a new escape room location, we recommend narrowing your focus to a geography that more accurately represents the limited travel distance of customers.
Market Conditions
Consider accounting for local market conditions, including demographic and economic restrictions that might limit or improve commercial viability.
For example, children are counted in our population estimates. But (depending on the games provided) children of certain ages cannot book and/or participate in escape room games.
Similarly, population estimates do not account for economic status. Escape rooms are, after all, a luxury that many families cannot afford.
Tourism & Travel
You might also consider account for tourists and out-of-state travelers. For areas with high volumes of tourists, comparing the number of escape room locations to residential population data under-represents the actual market opportunity.
Conclusion
Accurately assessing the market conditions for new escape rooms is difficult. But by measuring the density of escape room locations in a given area, you can make quick comparisons to similar locations and get a more accurate assessment of the commercial viability of opening a new escape room.
Considering additional factors, like demographics, economic status, and local tourism numbers will give you a more realistic picture of the market conditions in your area.
Market research like this is an important first step when considering opening your first escape room, but not the last. For more information on how to assess, build, and launch your escape room business, informed by successful owners across the US, check out our Escape Room Industry Report.


