


Every time you send out a customer satisfaction survey, the next step is to review the data and turn it into actionable insights and feedback.
This doesn’t necessarily mean that you need to go through each response manually — but rather, have a process in place to collect, store, analyze, and distribute the feedback.
When you perform a customer satisfaction survey data analysis, you come away with actionable insights to share with the rest of your team. When your survey responses start rolling in, your company should be prepared to act on them.
In this guide, you’ll learn how to perform a customer satisfaction survey data analysis so that you’re well-equipped to process future guest surveys.
How many travel and tourism brands measure customer satisfaction?
Is a customer satisfaction survey qualitative or quantitative?
What kind of statistical analysis should I use for surveys?
5 steps to analyze customer satisfaction surveys
- 1. Establish your goals
- 2. Clean up your data
- 3. Ensure your data is statistically significant
- 4. Use charts to visualize trends or changes in quantitative data
- 5. Compare your data to industry benchmarks
Actionable strategies for sharing the results with your team
How many travel and tourism brands measure customer satisfaction?
Every travel and tourism brand should continuously measure customer satisfaction.
Happy guests return to your venue and are more likely to recommend your attraction to others — while unhappy guests probably won’t do either. Over 90% of customers who rate a company’s customer experience as “very good” are likely to recommend it, while only 13% of those who gave a company a “very poor” rating say the same.
Understanding how satisfied your customers are with your guest experience is crucial to your attraction’s success. The most popular way to measure this is through customer satisfaction surveys.
While there are many different ways you can survey your guests, the goal is always to collect as much customer feedback as possible. That way, you can make informed business decisions about the future of your attraction.
Is a customer satisfaction survey qualitative or quantitative?
Customer satisfaction surveys can collect both quantitative and qualitative data. Quantitative data refers to numerical data and anything that can be counted or measured. Qualitative data, on the other hand, is more descriptive in nature.
Most surveys measure one of the following quantitative metrics:
- Net Promoter Score (NPS): How likely are you to recommend our attraction to a friend or colleague?
- Customer Satisfaction Score (CSAT): How satisfied are you with our guest experience?
- Customer Effort Score (CES): How easy was it for you to resolve your issue with our company?
Since respondents are asked to answer these questions on a numbered scale, these metrics provide quantitative data that can be analyzed in graphs and charts. This makes it easy for attractions to spot trends in guest satisfaction, identify changes over time, and compare how guests are feeling about specific aspects of the guest experience.
However, if your attraction wants to understand why guests feel a certain way, you’ll need to include open-ended questions in your survey.
Open-ended prompts — such as “What could we have done to make your experience better?” — result in qualitative data. These questions can reveal the reasons why a customer is dissatisfied with your business.
For the best survey results, use a combination of both types of questions.
Pro Tip: Start with scale or multiple-choice questions first to create a sense of progress before asking one that requires a more in-depth response.
What kind of statistical analysis should I use for surveys?
Data processing tools and statistical tests can help you better interpret your survey findings. You can use statistical analysis to identify meaningful trends in your data as well as dig deeper into the sources of customer dissatisfaction.
- Key driver analysis: Determines the key attributes of your customer experience that are influencing your guests’ responses. It helps your attraction identify the reasons behind the numeric scores guests are giving you. In other words, you’re able to pinpoint the aspects of your business that drive satisfaction and dissatisfaction among guests.
- Cluster analysis: You can identify whether there are clusters, or groups of similar guests, that share the same responses within a large pool of data. This analysis can be useful in discovering a link between satisfaction levels and demographic and/or preferences.
- Sentiment analysis: The ability to automatically analyze open-ended responses as positive, neutral, or negative. Then, you can focus on the responses that need your immediate attention.
5 steps to analyze customer satisfaction surveys
After you conduct a customer satisfaction survey, you need a plan in place to analyze the results. It’s in the survey analysis that you’ll find out how your customers feel about your attraction and what factors are driving that sentiment.
1. Establish your goals
Before writing your customer satisfaction survey, you should’ve identified its main objective. When you start your survey analysis, then, you’ll focus on the data that specifically relates to that.
Let’s say your company wants to understand the key drivers of customer loyalty.
You’ll then focus on finding your NPS score and following up with unhappy guests. You can visualize your NPS changes over time by transforming the data into a chart. Dive deeper into the results with key driver analysis, which will show you what aspects of your guest experience are driving the most satisfaction and therefore boosting customer loyalty.
2. Clean up your data
It is important to remove incomplete or unreliable data.
For example, a guest may have gotten lazy and answered an open-ended question with “fjhgfjh.” This response holds no value and will only clog your data unless removed. Some respondents might skip questions altogether, which can also lead to skewed results.
3. Ensure your data is statistically significant
You’re almost ready to start analyzing your survey results, but first, you need to ensure your data is statistically valid. This means that the number of guests who respond needs to be large enough to accurately represent the population being surveyed.
Statistically speaking, the less feedback you receive, the less reliable your data will be. You can use a sample size calculator to ensure that your survey data pool is big enough to provide accurate results.
4. Use charts to visualize trends or changes in quantitative data
The easiest way to visualize your numeric data is to translate it into charts and graphs.
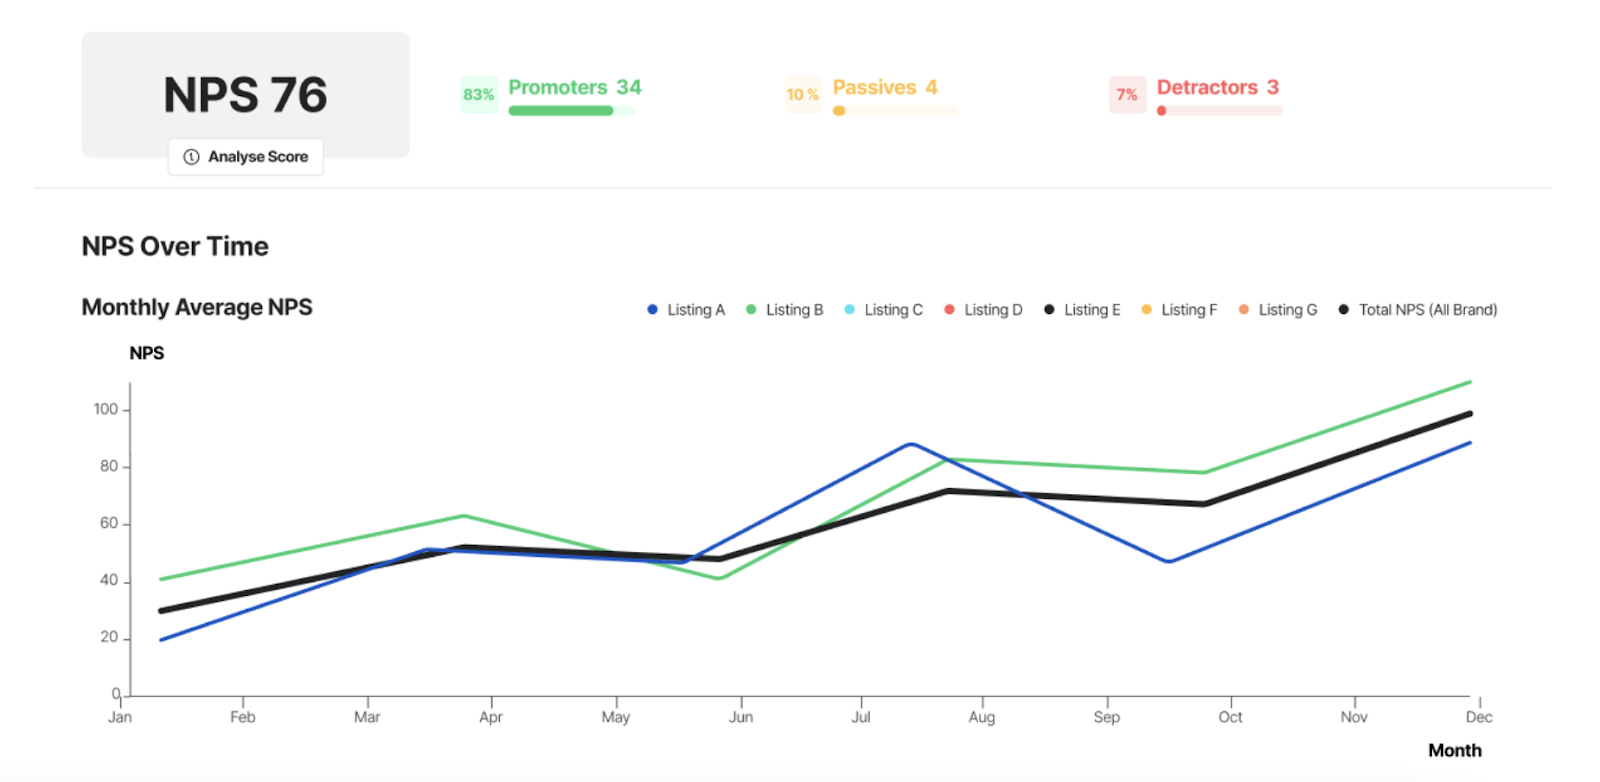
For example, you can create a graph to record your NPS scores over time, which will help you track changes in your score over time. This will also make it easier to spot patterns or trends during that period.
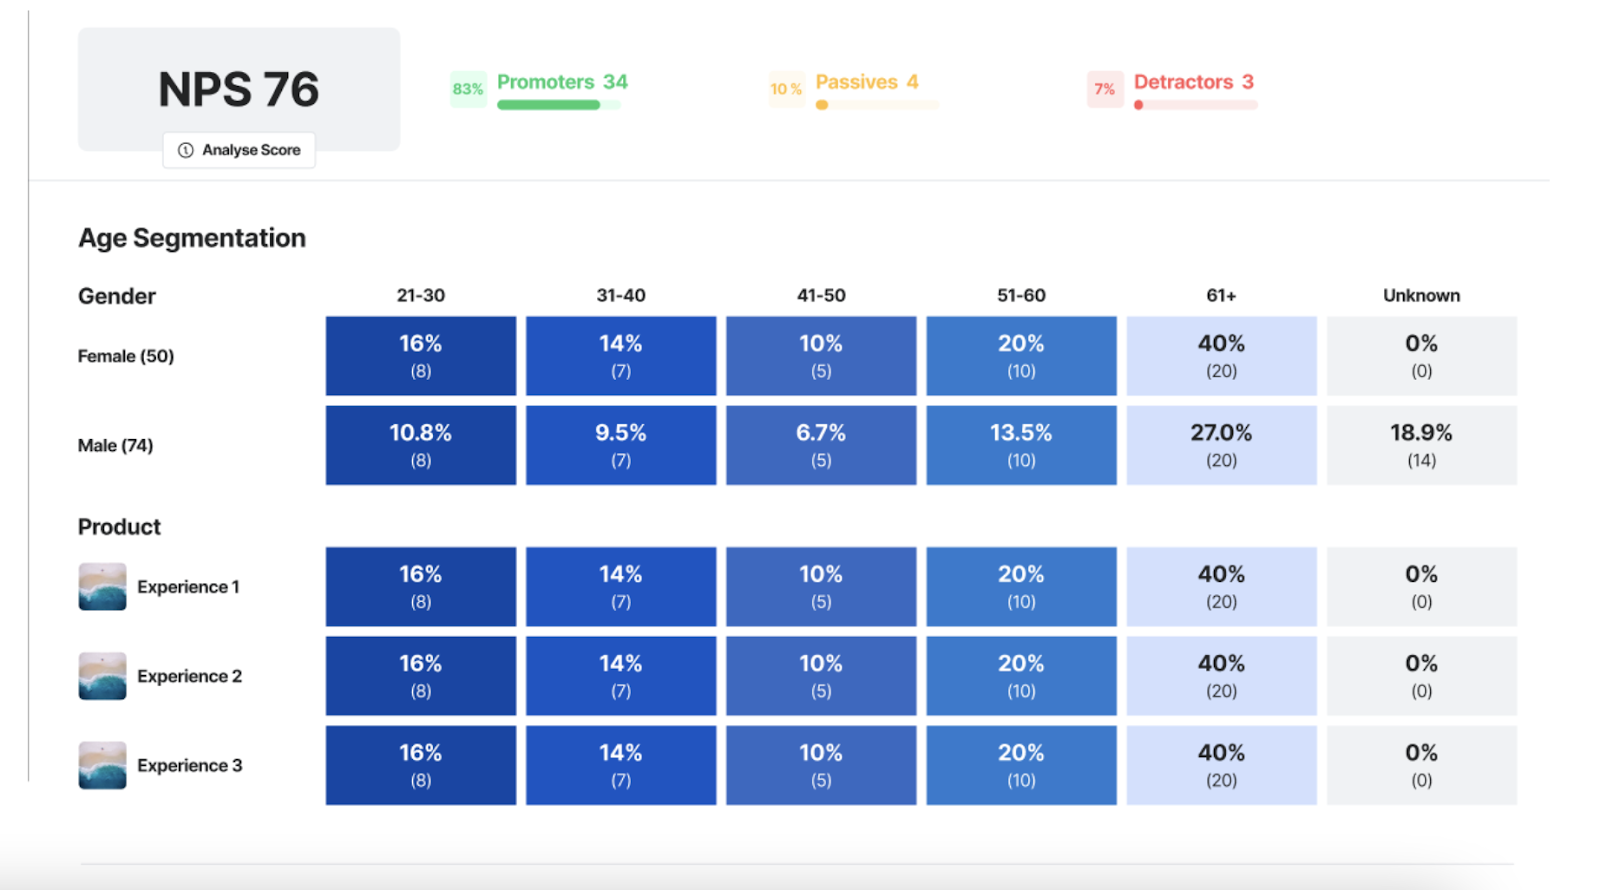
Another option is to create a bar chart showing the frequency of responses based on different demographics. The example below breaks down NPS score by gender and age to help highlight potential trends.
5. Compare your data to industry benchmarks
Before you decide whether your NPS score is good or bad, see how your company stacks up to its competitors. It helps to use survey industry benchmarks as a frame of reference when interpreting your data.
Travel websites, for example, have an average NPS score of 32. This tells us that if your travel site has a score of 35, it’s performing above average.
It also helps to look at your company’s historical data from similar surveys done in the past. Comparing your current NPS score against your score from six months ago helps you visualize your progress over time.
Actionable strategies for sharing the results with your team
You likely won’t be keeping your survey results all to yourself. Your team can learn a lot from your customer satisfaction surveys, especially when the questions relate to their specific roles at your attraction. To share the most relevant results with them, follow these three tips.
Package your results into a survey report
At some point, you’ll want to present your findings to your team. The best way is to create a customer satisfaction survey report, which will explain the survey’s purpose and major takeaways.
Creating a report makes it easy to share your survey feedback with various company stakeholders and employees. You can email them the document or hand them a printed version.
Pro Tip: Include a short survey summary at the beginning of your report. Use the summary to highlight a key takeaway, inform the reader what they’ll learn, and persuade them to continue reading.
Be mindful of your target audience
Consider who you’re sharing your survey results with before creating your report. If you’re planning on sharing a survey report with your guests, for example, you’d want to let them know what actions you’re taking based on the feedback they’ve given you.
When sharing your findings internally, on the other hand, your report should highlight actions for specific departments.
For example, perhaps the survey results showed that your customer support team is taking too long to pick up the phone. This isn’t something that necessarily impacts your marketing team. So in the results section, you’d include action items like “improve First Response Time” for that specific team.
***
Now that you’re equipped to analyze your survey results, it’s time to check in with your guests. Let this comprehensive survey analysis guide walk you through the process of organizing and interpreting the valuable feedback you receive.