

Keeping track of your revenue activity on a consistent basis can help you reach your financial goals — especially if you develop the practice of sharing these reports with the rest of your company. This ensures that everyone is on the same page and allows each department to make better decisions based on that data.
In this post, you’ll find several revenue report templates to help you stay on top of your bookings on a daily, weekly, monthly, and quarterly basis.
What is a revenue report template?
A revenue report template is a report or dashboard that helps you summarize your tour business’s revenue activity over a specific period of time.
The most common revenue reports include the Profit and Loss Statement, also known as the Income Statement, Balance Sheet, and Cash Flow Statement. A revenue report template will provide you with a blueprint to create each of these.
It’ll tell you what metrics to input so that the report can be made.
How often should you prepare a revenue report?
Pulling daily, weekly, monthly, or quarterly revenue reports helps you understand how your business is operating on a short- and long-term basis.
These reports reveal valuable insights into the financial health of your business. If you spend a few months without analyzing your finances, you risk losing track of important metrics that keep your company afloat.
Small businesses can benefit from looking at their Cash Flow Statement on a weekly or monthly basis. Your cash flow is the money coming in and out of your business based on the day a booking was made.
Tours and attractions should also track realized earnings, which happen once the tour or experience is complete.
Since you likely have monthly expenses like rent, it’s helpful to understand the money that comes in and out each month.
What metrics should be included in a revenue report?
The Profit and Loss Statement typically tracks four core financial metrics: income, expenses, cost of goods sold, and net income.
- Income: The money received by your tour business or attraction
- Expense: The expenses associated with running your business, including overhead and sales and marketing costs
- Cost of Sales: The cost associated with delivering a service
- Net Profit: The amount of money your business makes after deducting the cost of sales and expenses from income
The Balance Sheet tracks what your company owns and owes. It specifically looks at your company’s assets, liabilities, and shareholder equity.
- Assets: Everything your tour business or attraction owns like vehicles, equipment, building(s), etc.
- Liabilities: Everything you owe, such as a small business loan or credit card debt
- Shareholder Equity: Everything you and other shareholders of your company have invested in the business
The Cash Flow Statement gives you a snapshot of the money coming in and out of your business. This includes money received from bookings or ticket sales, investing, and financing.
In addition, these three business metrics can give you a good idea of your company’s performance:
- Sales Revenue: All the income your company has made through tour bookings or ticket sales, excluding the cost associated with refunds or chargebacks.
- Net Profit Margin: How much profit is generated as a percentage of the revenue received. Your Net Profit margin highlights how much of each revenue dollar collected by your company actually translates into profit.
- Gross Margin: The amount of money your company keeps after the direct costs associated with providing the services you provide.
- Sales Growth: Monitor your sales growth monthly or yearly to identify the pace at which your company’s sales revenue is increasing or decreasing.
- Cost of Customer Acquisition: How much it costs your company — typically in marketing expenses — to acquire a new guest.
Daily revenue report template example
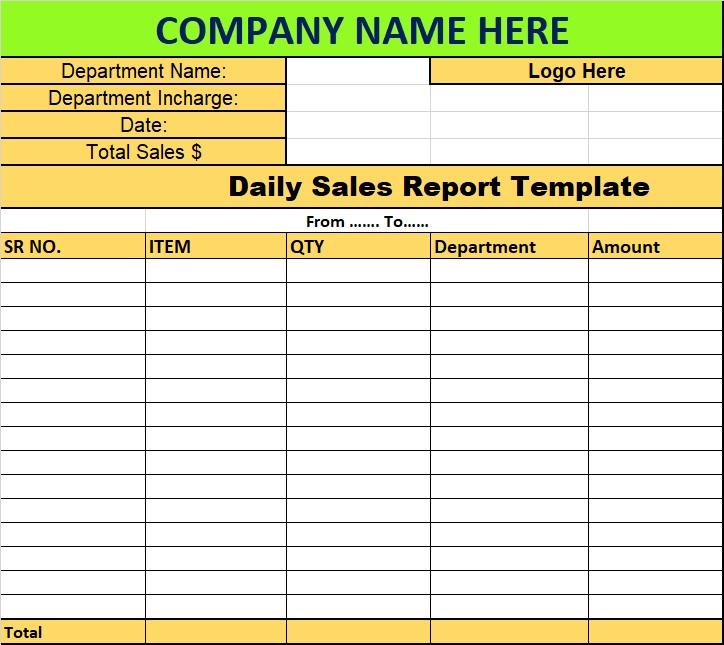
Source: Free Report Template
If you run a tour business or small attraction, you’re likely tracking your bookings or ticket sales on a daily basis. A daily revenue report shows you a summary of all your company’s transactions broken down by day.
Weekly revenue report template example
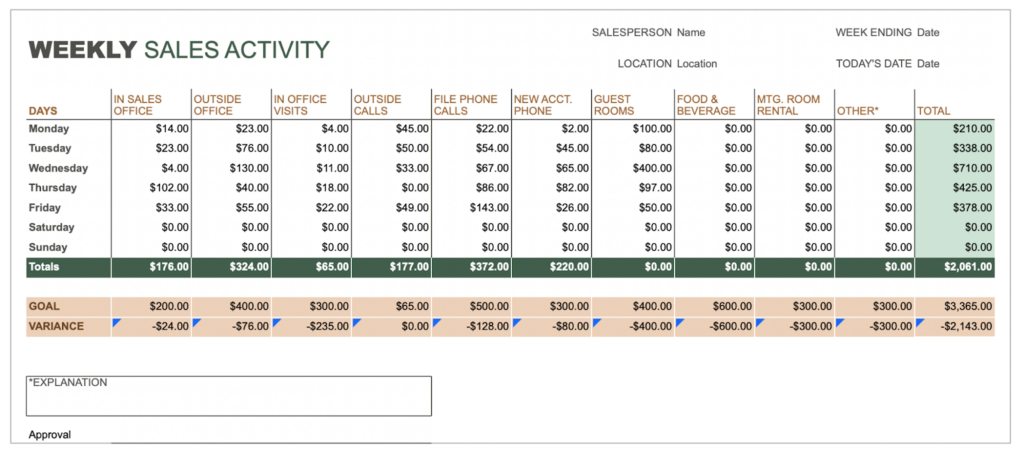
Source: Microsoft Office Templates
You can use a sales report to keep track of bookings on a weekly basis. The template above specifically tracks sales revenue against a goal.
First, edit the columns to match your business’s revenue metrics, such as in-person bookings, online bookings, third-party bookings. Then, you plug in the numbers. By the end of the week, you’ll have a complete sales activity report to present to your team.
Monthly revenue report template example
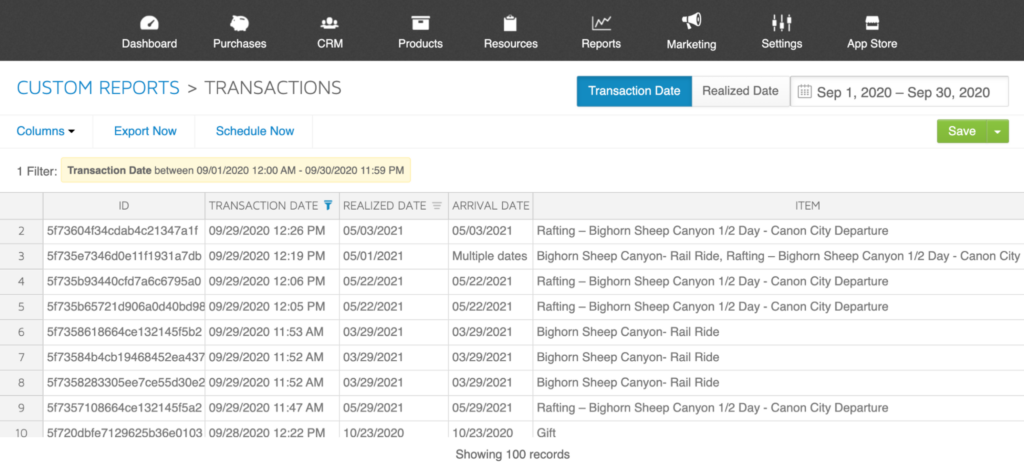
Xola’s transaction report contains financial details for every charge or refund associated with your bookings.
You can view your transactions for any date range. In this example, the report is showing the transactions made during the month of September 2020.
After viewing this report in the Xola dashboard, you can then export it into a spreadsheet.
Source: Microsoft Office Templates
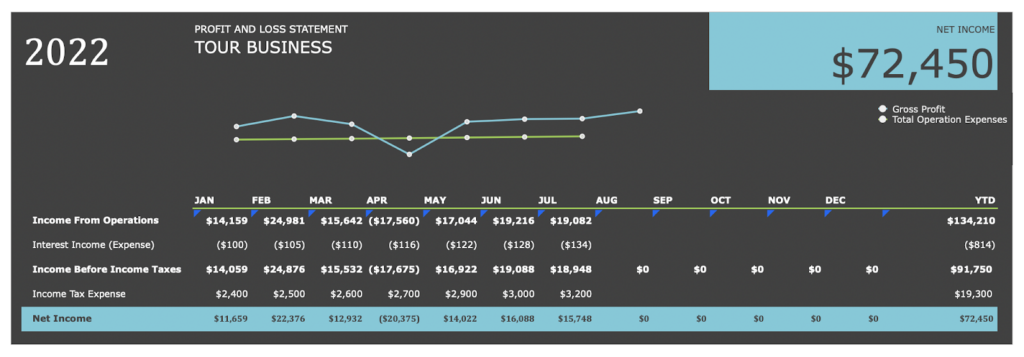
Here’s a look at a Profit and Loss Statement broken down by month. As you’ll see in the report above, the business records the income for its operations every month, as well as its expenses.
You’ll also find the net income at the bottom, or the amount your business makes after deducting costs of services provided, operating expenses, interests, and taxes.
The net income is a good indicator of your company’s profitability. Tracking this metric every month helps you understand how much of a profit your company will make over a year.
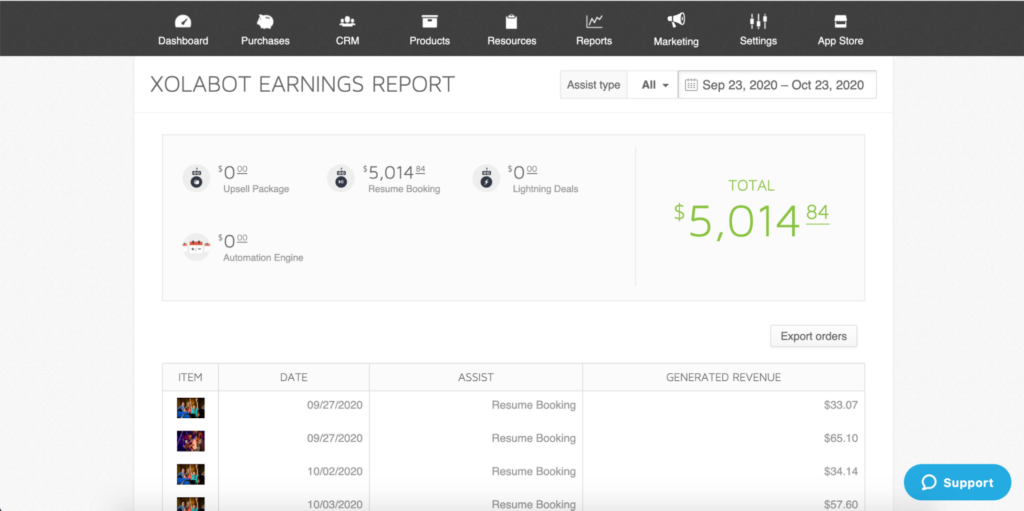
You can also pull monthly reports to see how specific marketing tools and campaigns are performing. In the example above, a monthly earnings report was pulled for Xolabot, an automatic growth feature used to upsell experiences, offer deals, and rescue abandoned bookings.
The report shows that Xolabot brought in over $5,000 with the “resume booking” feature that reminds customers to complete their purchase.
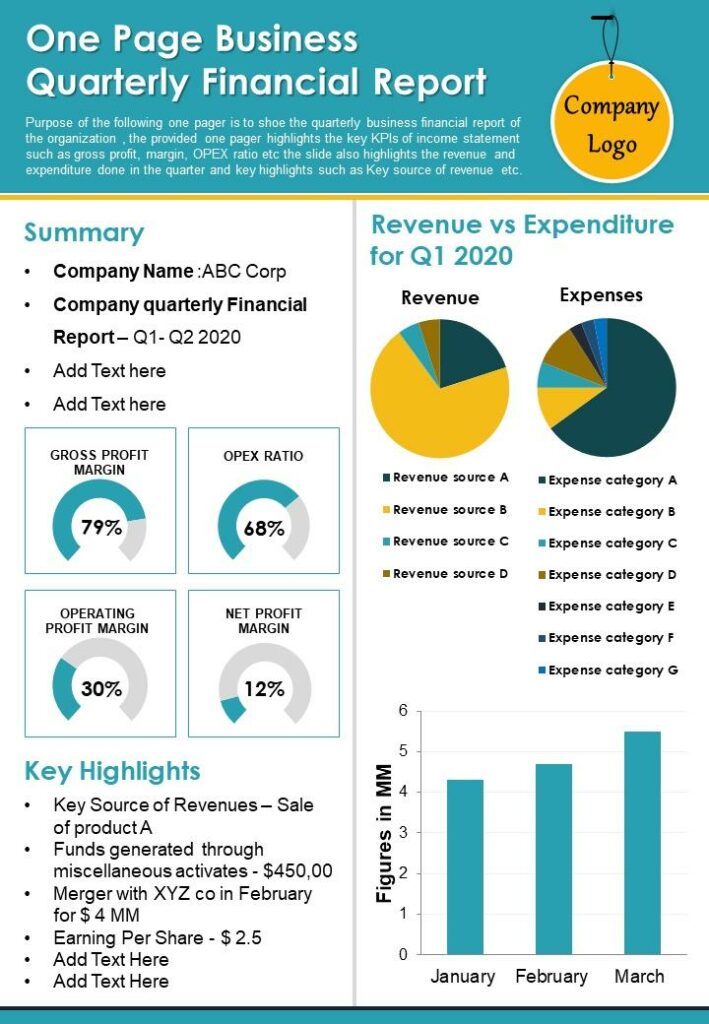
Quarterly revenue report template example
Source: Slide Team Blog
A quarterly report gives you a three-month snapshot of your financial activities. This revenue report template zeroes in on a few key metrics like gross profit margin and net profit margin — both of which help you accurately track your company’s profitability. It also takes it a step further and compares your revenue versus expenses.
Source: Prophet Invest
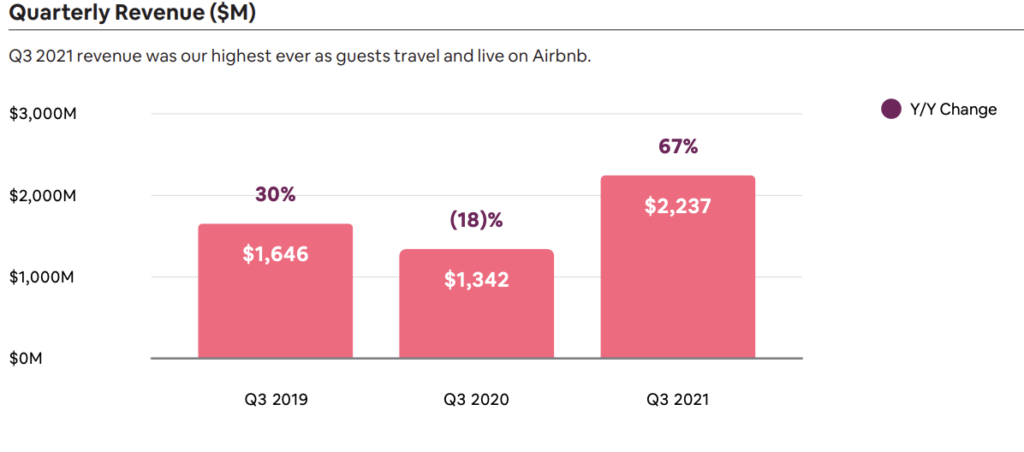
As with most revenue reports, quarterly reports can be customized to display the data that matters most to your company. They can be used to track company revenue growth, as shown in the Airbnb example above.
Airbnb’s upward trajectory from Q3 2019 to Q3 2021 shows that people are traveling again, and that the service is gaining popularity in post-pandemic travel.
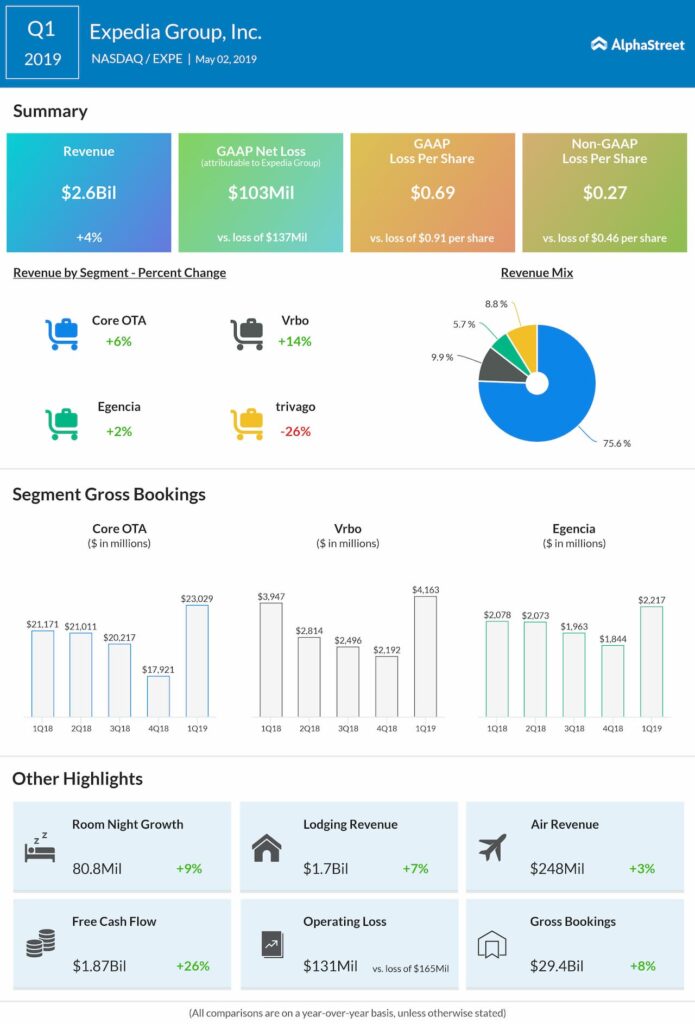
Quarterly reports can also break down your revenue by segment, as shown in this example for Expedia Group. The Online Travel Agency’s (OTA) revenue is broken down by the different brands it owns, like Vrbo and Trivago.
This gives the company a snapshot of which brands are performing best over time.
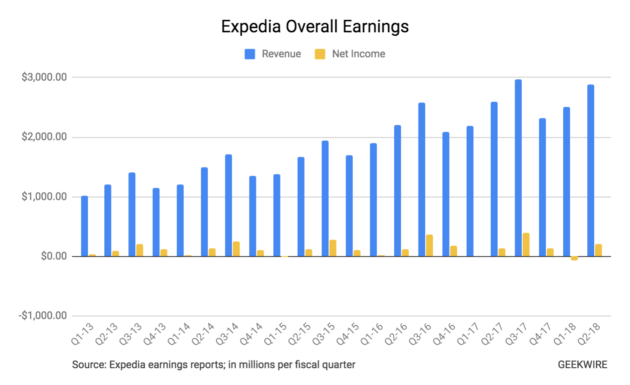
Source: GeekWire
Quarterly reports are also useful to observe historical revenue growth. In the example of Expedia shown above, the online booking marketplace displays its overall earnings broken down by quarter from 2013 to 2018.
This way, the company can compare its quarterly performance over the course of several years.
When you track your quarterly earnings, you can also make a report like this to view your company’s financial history over time.
***
Staying on top of your finances is the best way to ensure your profitability. And revenue reporting is the best way to do that.
The examples shown in this post can be easily used as templates to build your own reports — all you need to do is change the labels and metrics to fit your business.
Building revenue reports is even easier with a booking software like Xola, which allows you to automate the process. Xola gives you access to several financial reports so that you always have your company’s revenue data at your fingertips.