

Small businesses should be consistently tracking their finances — but that doesn’t necessarily mean it has to be a tiresome and grueling task.
If you have access to the right data, you can build revenue reports that help you stay on top of your operating costs, expenses, and income. Better yet, most booking software like Xola provide these reports for you.
In this post, we’ll learn how to view and read a revenue report, including several examples of reports in Xola that are most relevant to your tour business.
- What are revenue reports?
- What’s included in a revenue report?
- How often should you look at your revenue reports?
- 8 revenue and booking reports in Xola
- Customer Report
- Itemized Purchases Report
- Payouts Report
- Earnings Report
- XolaBot Earnings Report
- Gifts / Store Credit Report
- Capacity Utilization Report
- Custom Reports
What are revenue reports?
A revenue report is a financial document that breaks down your company’s revenue over time.
The three most common revenue-based reports for tour businesses and attractions are the Profit and Loss Statement (P&L Statement), Balance Sheet, and Cash Flow Statement.
- The P&L Statement displays your company’s total revenue and expenses, which helps you gauge how profitable your tour business is at any given time.
- The Balance Sheet, on the other hand, looks at your total assets and liabilities (what you own vs. what you owe).
- The Cash Flow Statement is a detailed snapshot of all the money coming in and out of your company.
What’s included in a revenue report?
You likely have more than one revenue stream, from ticket sales and tour bookings to gift card sales and merchandise.
The first step in building a revenue report is to sum up all of the money your company has brought in over a specific time period. That’s your revenue. Yet unless you’re a sole-owner-operator walking tour, a good chunk of that revenue goes toward your operating expenses.
This is why you’ll need to calculate your expenses and include that in your revenue report.
Your expenses are made up of both fixed and variable costs, or those that change based on booking volume.
The most common fixed expenses for tourism businesses are rent, internet, website maintenance, and monthly marketing fees. Meanwhile, staff wages, tour equipment, vehicles, gas, and third-party commissions are variable expenses that also factor in.
Once you’ve tallied up your expenses, you’ll begin to understand how much it costs to run your business. The cost of services sold is an important metric that tells you how much it takes to run your tours and experiences.
With this figure in mind, you now know how much revenue you need to generate to cover your expenses.
The next logical step is to calculate your profit.
Profit = Revenue – Expenses
In its simplest form, your profit is revenue minus expenses. But you can get a more detailed look at your finances by taking this revenue report a step further.
Gross Profit Margin = (Net Revenue – Costs of Sales) ÷ Net Revenue
You can find your gross profit margin, which shows you how efficiently your company is running its tours or experiences given the costs directly involved with delivering those services. This metric is calculated by subtracting the cost of sales (COS) from the revenue that service generates.
Net Profit Margin = Net Profits (or Income) ÷ Net Sales (or Revenue) ∗100
The net profit margin is another useful metric to include in a revenue report. It measures how much net income or profit is generated as a percentage of revenue. This is calculated by dividing the net profits by revenue, and multiplying by 100 to get a percentage.
A detailed revenue report like this will give you a holistic e view of your company’s financial performance.
How often should you look at your revenue reports?
Most business owners will review their financial reports on a weekly basis.
Some reports like the Cash Flow Statement, for instance, should be looked at on a weekly or monthly basis. As a small business, you’ll want to be aware of all of the money coming in and out of your business based on when bookings were made.
This report will also highlight your realized earnings, or the revenue that’s been realized after a tour or experience is complete.
Checking your P&L Statement monthly or quarterly can also help you understand how your business is operating on a short- and long-term basis. This can help you stay on track of fluctuating monthly expenses that change with your booking volume.
8 revenue and booking reports in Xola
With Xola, you’ll have access to several key reports that’ll show you the financial state of your business.
Customer Report
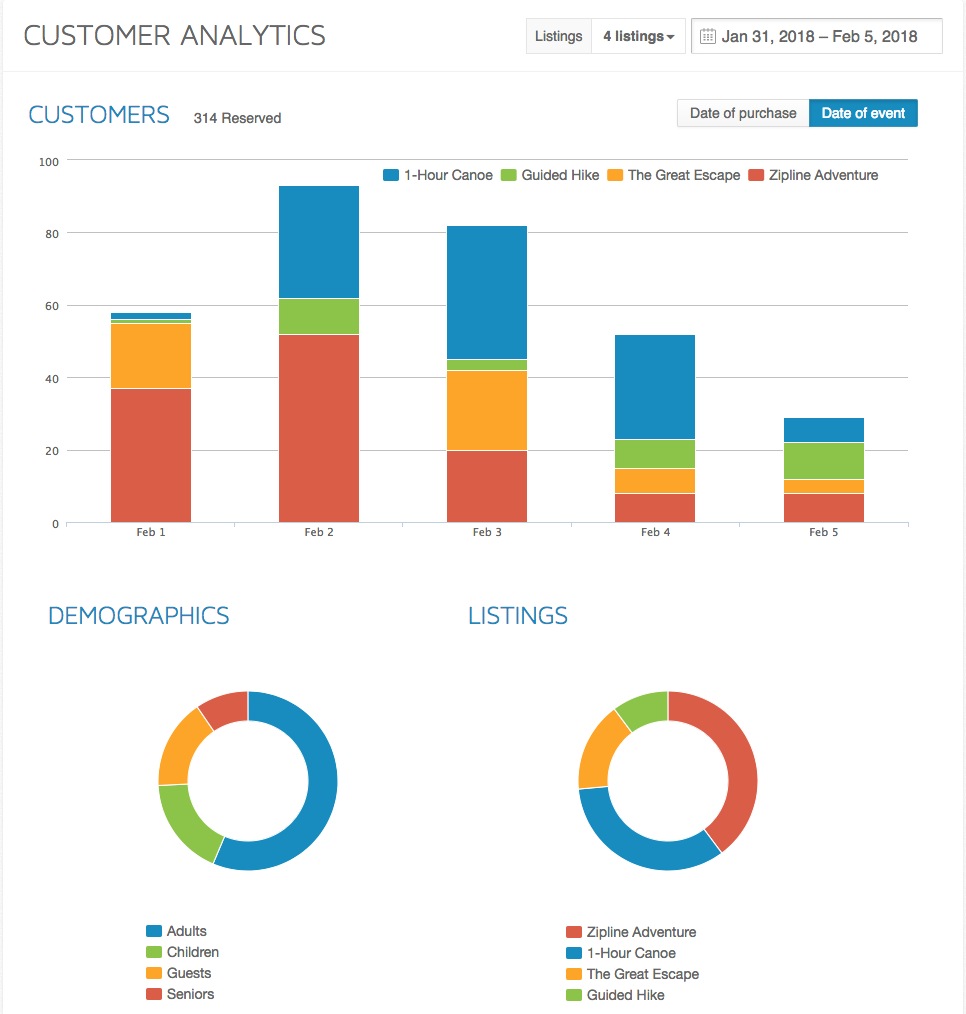
The customer report shows you the number of customers that have booked a particular tour over a given time period. You can filter the report to view the total customer count for individual tours as well as for the entire day.
The demographics section will break down your bookings based on the chosen demographic categories. Meanwhile, you can also compare the number of bookings between each of your tour listings.
This report can be used to visualize trends in customer volume across different tour offerings and seasons.
For example, you can use this report to find out which of your tours is the most popular during the month of August.
Itemized Purchases Report
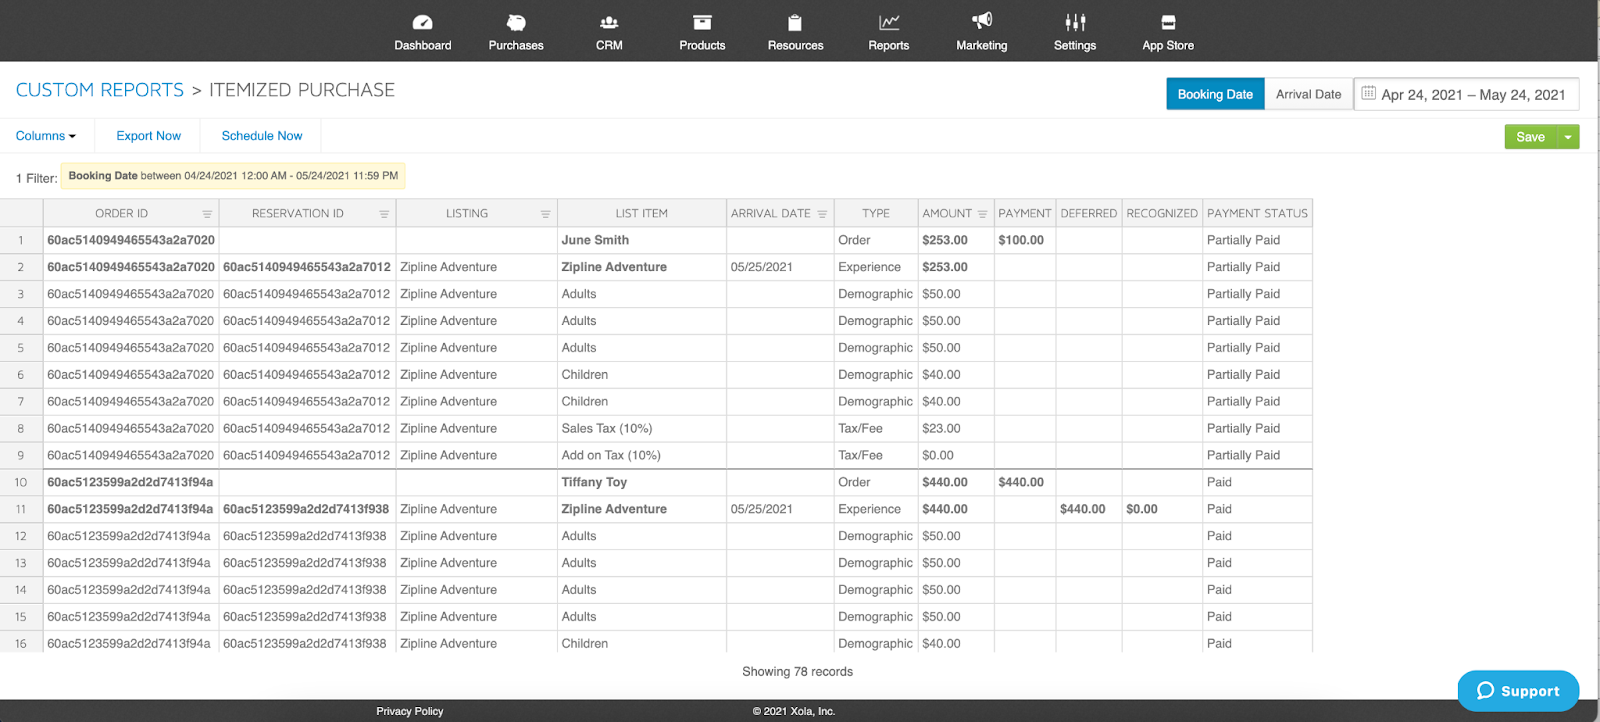
The itemized purchase report breaks down each booking into granular line items like demographics, taxes, fees, and add-ons.
When you export the report to Excel, you will be able to see a summary page that provides you with information about each line item for the date range you’ve chosen.
This is a great report for your accountant or bookkeeper who may want to delve into the details behind every booking, including the tour listing name, booking date, the day the tour will take place, price, and payment status.
Having all of this information organized and exported into an Excel document makes it easier for you to keep track of who is booking your tours and whether or not they’ve paid them in full.
Take a look at the photo example above. Let’s say you want to know whether guest June Smith has paid her zipline excursion in full. You’d pull the report and find that she has paid $100 out of the $253, while guest Tiffancy Toy has paid hers in full.
Payouts Report
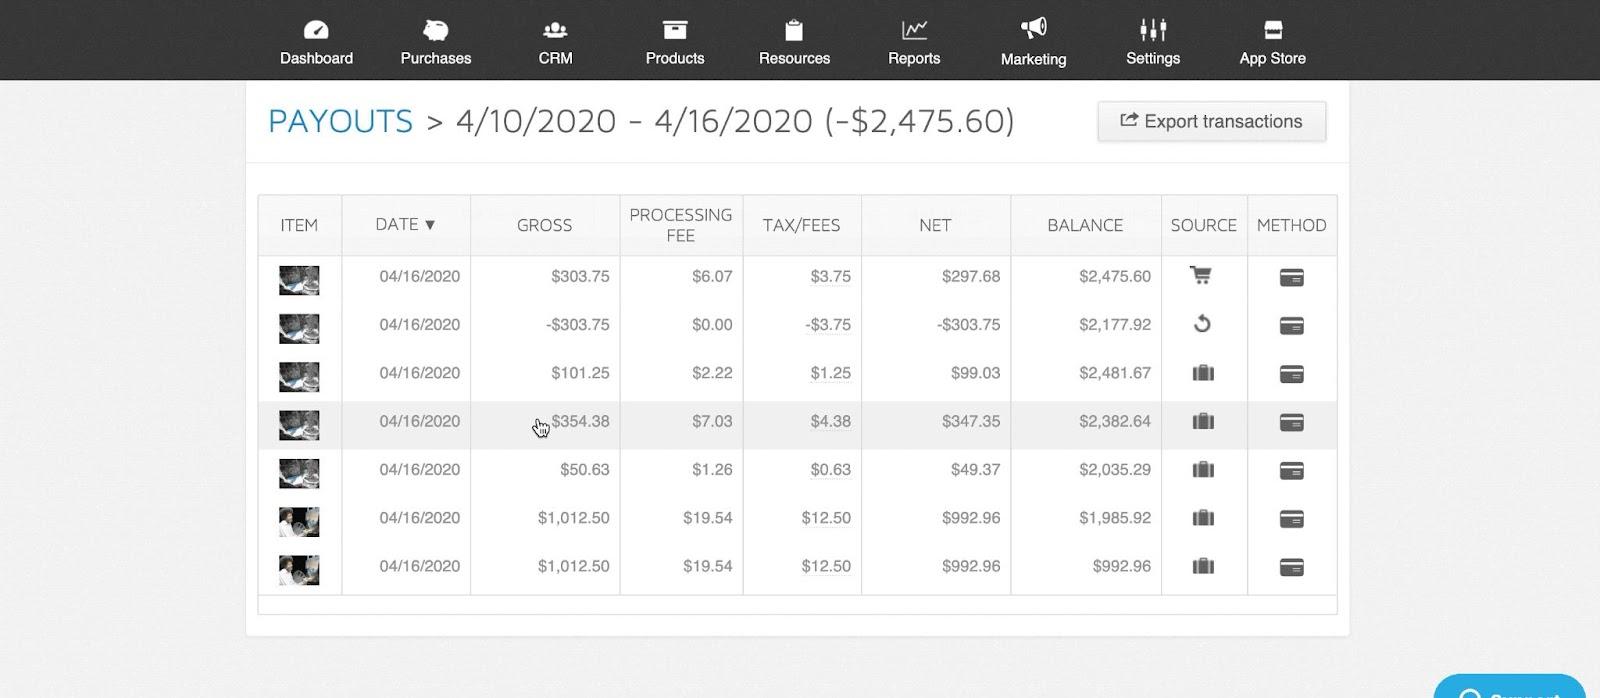
The payouts report lists every deposit that you have received from Xola to your bank account. You can then select an individual payout row to reveal an itemized list of transactions that make up the total payout amount.
This comes in handy when you want to understand where your revenue is coming from. If a $500 payout drops into your account today, you can look at this report to see what tours and add-ons brought in the money.
Earnings Report
Your earnings report is a daily transaction breakdown. If you want to look at all of the transactions made on Monday, for instance, you’d pull an earnings report for that date.
However, you should be careful when using earnings report to account for overall revenue. Xola’s earnings reports count both the sale and redemption of gift certificates as revenue — and counting the numbers twice can throw your numbers off.
For example, if you sell a gift certificate for $50 cash, the earnings report will record the $50 as cash earnings.
When the customer uses that gift certificate to book a tour, the earnings report will again record $50 of gift certificate earnings. This would make your revenue for the day $100. But that’s how much value is in your cash drawer, not the revenue you brought in as a business.
Overall, the transactions shown in the earnings report are meant to help you balance your cash drawer.
XolaBot Earnings Report
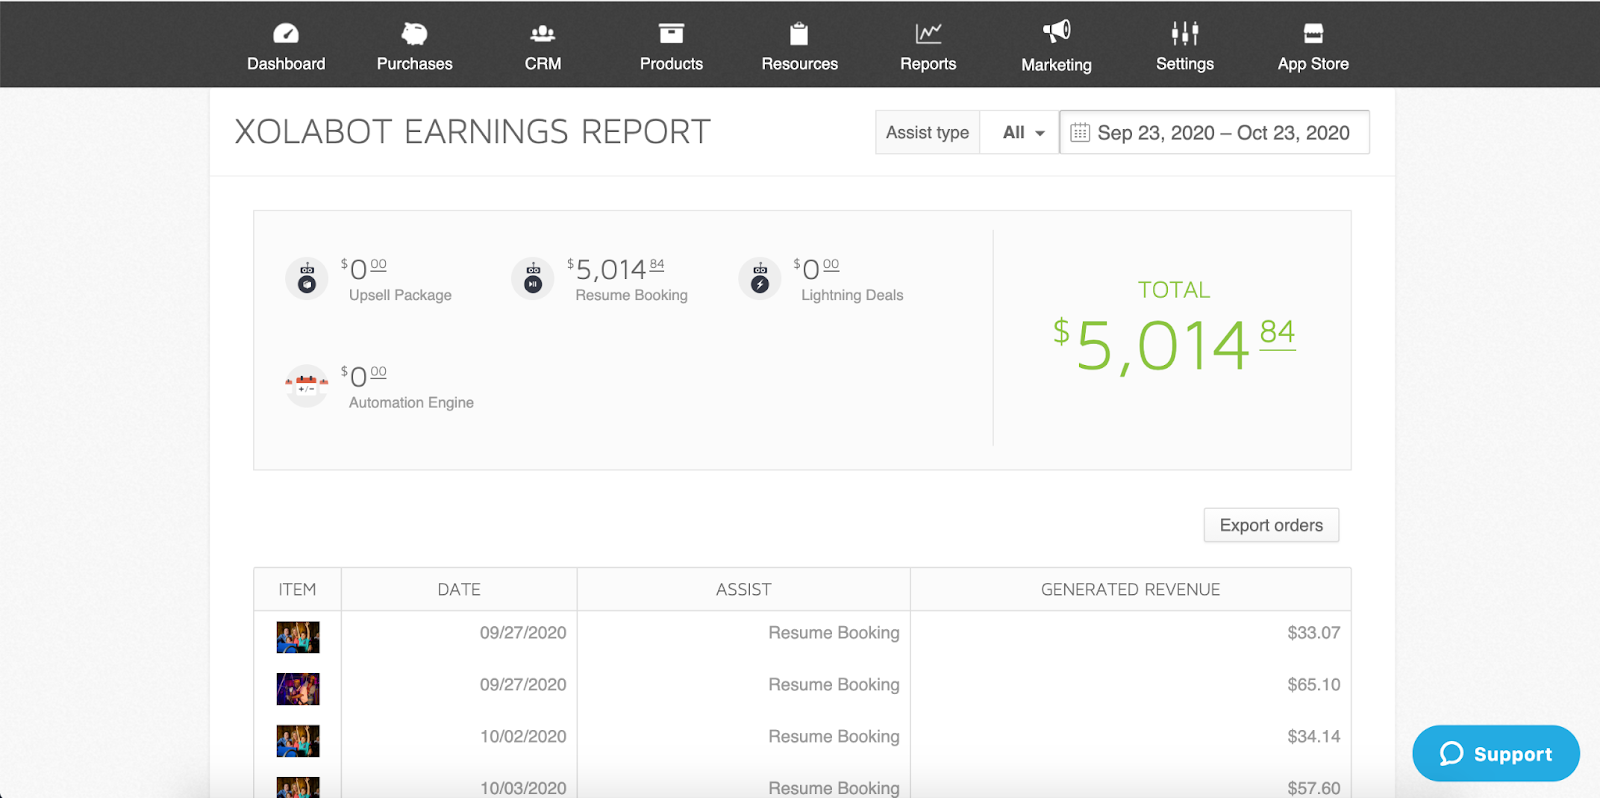
XolaBot is Xola’s automated marketing and sales assistant. The tool fully integrates into your website to help drive revenue in various points of the customer journey.
For example, XolaBot can offer a Lightning Deal to incentivize price-sensitive customers to book less popular time slots. It can also reengage guests that haven’t completed their bookings by using a chat prompt asking them to continue their reservation.
The XolaBot earnings report shows you the revenue generated from these automated tools. If you wanted to find out how effective your Lightning Deals campaign is, for instance, you can find out by pulling this report.
Gifts / Store Credit Report
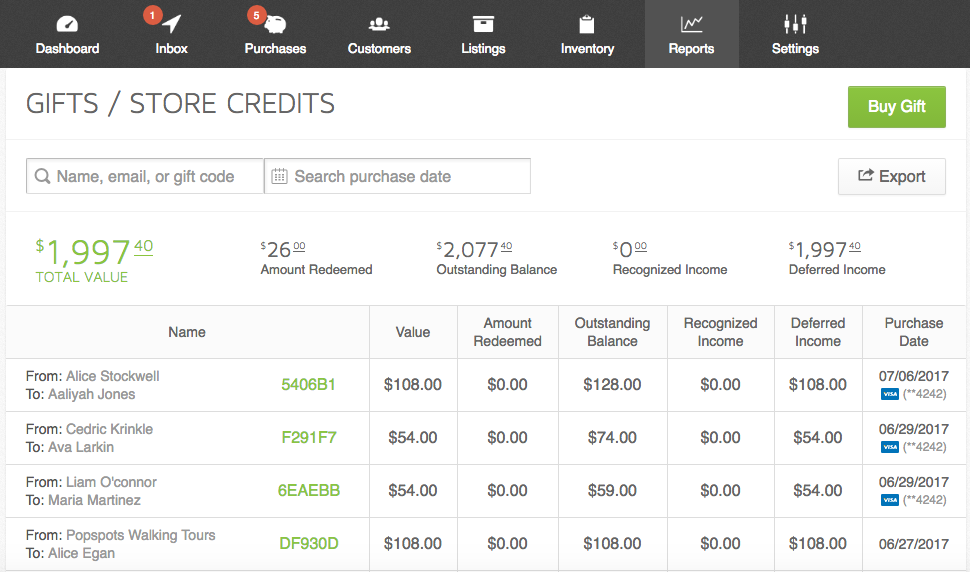
The gifts/store credit report helps you keep track of gift card sales and redemptions. Gift cards are a wonderful way to boost your sales, especially during the holidays with Black Friday, Cyber Monday, and Christmas.
You’ll be able to view the following information in your gifts/store credit reports:
- Gift value: The original purchase amount of the gift card.
- Amount redeemed: The dollar amount that has been applied toward a booking.
- Outstanding balance: The dollar amount remaining on the gift card that can be applied toward a booking.
- Recognized income: The dollar amount that has been applied to a booking that has already taken place.
- Deferred income: The dollar amount that has been applied to a booking that has not yet taken place, or the overall value associated with the gift card that has not yet been redeemed.
If you ran a buy-one-get-one gift card campaign on Black Friday, this report would help you keep track of the number of gift cards sold and redeemed over that time.
Capacity Utilization Report
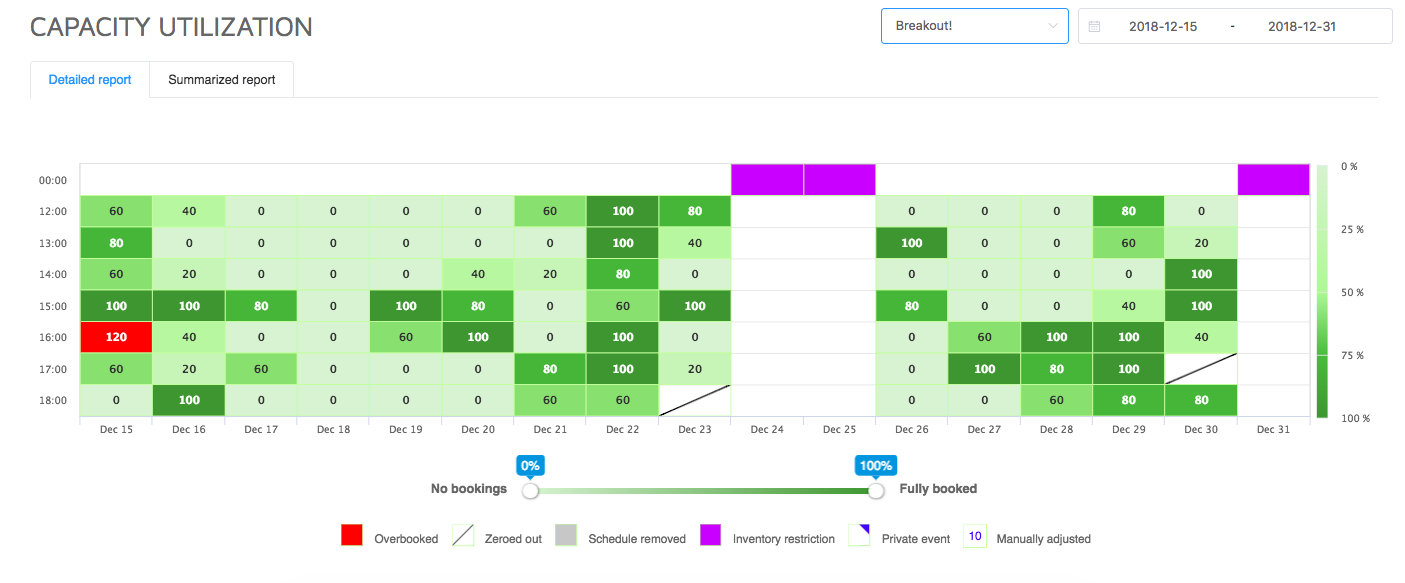
The capacity utilization report shows you what percentage of your time slots are booked for a chosen listing over a period of time. As you can see in the image above, you can view a heat map of your time slots to find out which are the most and least popular.
Knowing this, you can strategically price your tours to optimize your capacity. For example, you can attract more people to your less popular tours by offering those at a discounted rate.
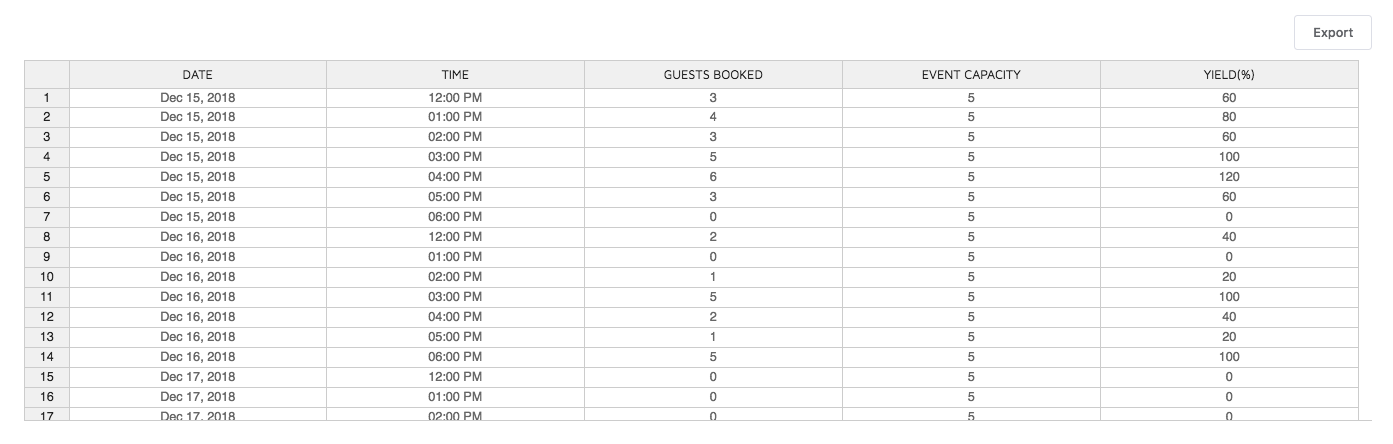
You can further break your capacity utilization report down to how many guests are booked for each particular time slot in relation to that tour’s capacity and yield.
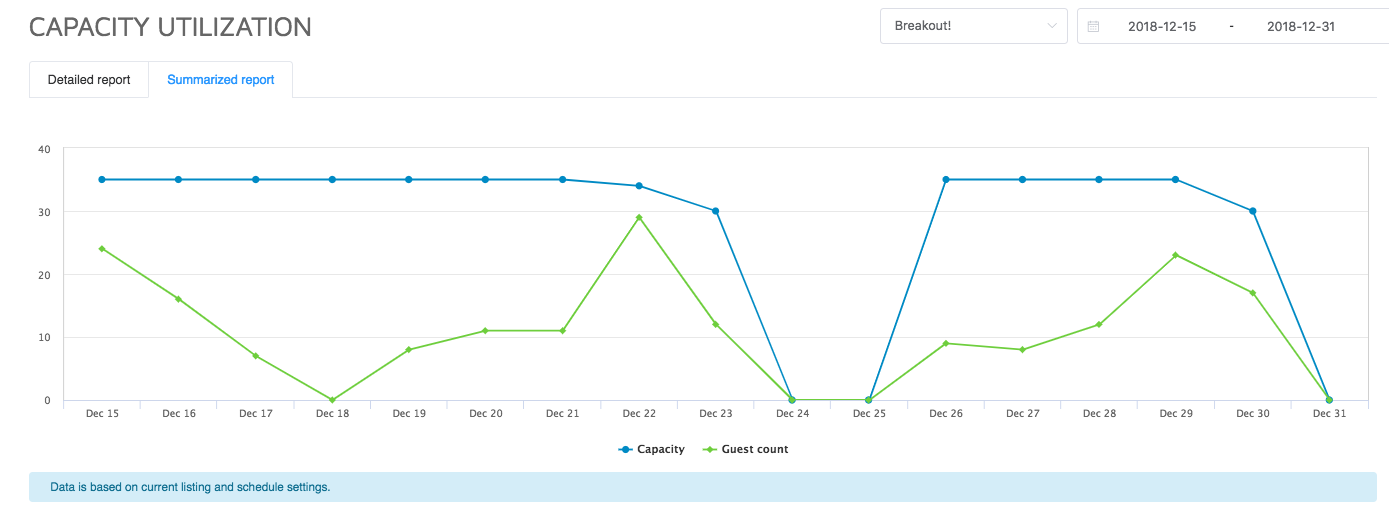
This report also allows you to compare your total capacity with your guest count over the same date range.
Capacity planning helps your company ensure it has enough staff or equipment to run your tours. Without it, you risk overworking your staff and overbooking your experiences.
The capacity planning report can be used to guide your businesses in its resource planning so that you’re well-prepared for changes in demand.
Custom Reports
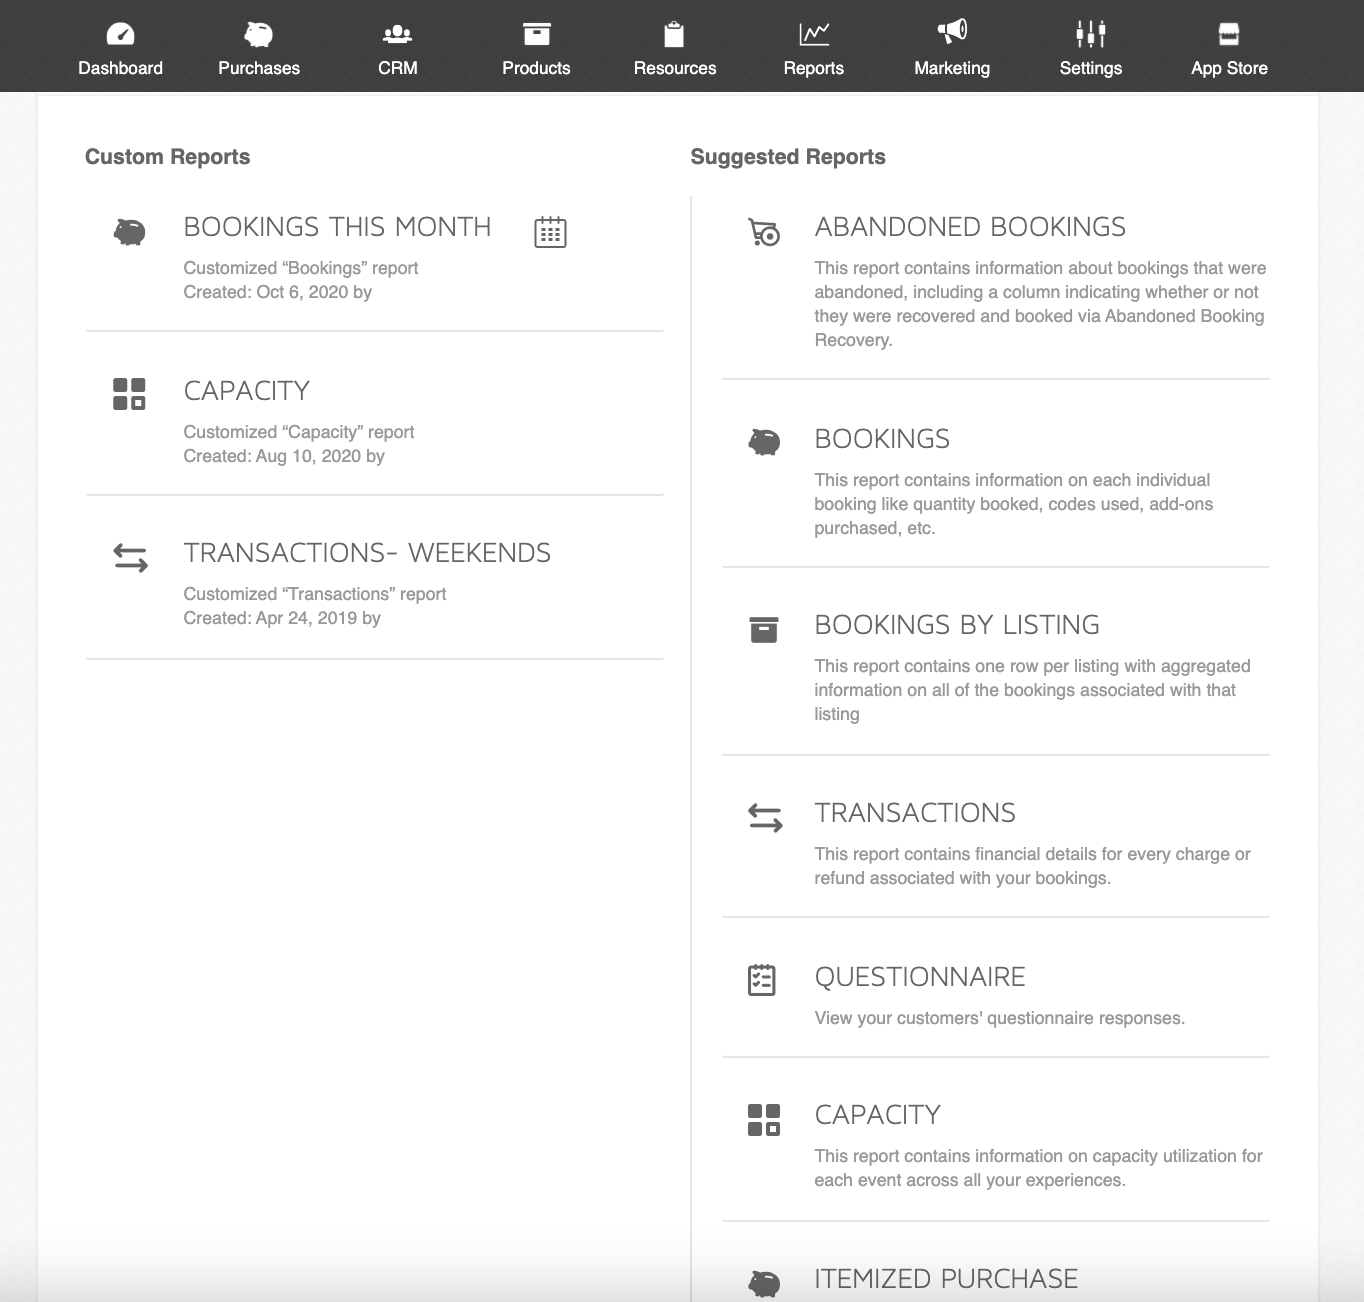
You’re also free to make your own reports with Xola’s custom reporting feature. Custom reports allow you to create, save, and schedule revenue reports based on a suggested template.
This level of customization means you can create reports that help answer questions specific to your business.
If you wanted to find out how many confirmed bookings have a balance due for the upcoming month of May, for instance, you could. Or if you wanted to find out how many abandoned bookings you recovered during the month of January, you could do that, too.
***
All in all, tracking your revenue and booking volume is easy with Xola. Whether you’re focused on increasing revenue, improving your capacity, or coming up with a better pricing strategy, a good booking software should make the process smoother.
With Xola, you’ll get access to the myriad of reports listed here and more.