Tourism attractions have a wealth of guest data available — but are they using it to their advantage?
That’s where big data analysis comes in. Statistical analysis is one of many techniques, including sentiment analysis, predictive analytics, and key driver analysis, that help businesses collect and analyze large amounts of data to discover patterns and trends about their customers.
This technical approach to data analysis can provide businesses with valuable insights to inform future decisions. It can help attractions spot trends in customer behavior and better understand what drives their decisions to make a booking. This data can be further interpreted to predict ticket sales and booking revenue over a period of time.
In this post, you’ll learn more about how statistical analysis can benefit your company.
What are the different types of statistical modeling?
4 benefits of statistical modeling
- Make use of existing data
- Allows your business to make decisions based on real data
- Leverage machine learning and artificial intelligence
- Free up your staff
How can tours and attractions use this to improve their businesses?
- Better understand customer behavior
- Identify what makes your customers tick
- Predict future customer behaviors
- Stand out from your competitors
- Increase your revenue
- Forecast demand
What is statistical modeling?
Statistical analysis is the process of using statistics-based models to collect, analyze and present large amounts of customer data. The goal is to find underlying patterns and trends that can help your business make decisions about how to improve operations.
Tourism businesses can use this kind of data analysis to learn more about customer behavior, identify strengths and weaknesses in the guest experience, and better meet guest expectations.
What are the different types of statistical modeling?
Statistical analysis is best used to find correlations between customer behavior and the factors that make up your guest experience — and there are several ways to approach this. Here are a few of the most common statistical models used to analyze business data:
- Regression: With this approach, a business can analyze the relationship between a dependent variable (ticket sales) and an independent variable (queue times). Let’s say you’ve had a decline in ticket sales, and you want to test the hypothesis that long queue times are causing this decline. A regression model could be used to visualize the downward trend in sales and find if there’s a connection between increasing wait times.
- Classification: This model uses machine learning to interpret large and complex sets of data, then organizes this data into different categories to make it easier to analyze. Your guests, for example, can be classified into different categories based on their buying patterns. A classification model can be used to predict what kind of guest has a greater likelihood of making a booking. Then, you can send them promotional offers and discounts accordingly.
- Resampling: Repeated samples are drawn from the original data set to create a unique sampling distribution based on real data. To ensure your feedback survey results accurately represent your whole audience, you would use a resampling model to repeatedly draw samples from your population for statistically valid data.
- Cluster: This kind of analysis can identify related groups of customers, ticket sales, and guest behaviors. Your attraction could use cluster analysis to identify guests with similar traits based on their behavior. For example, you can group together guests that often open your emails. Then, you can better tailor your email marketing to this particular group, sending them more promotions than other groups.
4 benefits of statistical modeling
Let’s take a deeper dive into how your business can use statistical modeling to improve operations. Specifically, how your existing customer data can help you make informed decisions about the future while freeing your staff to focus on more important things.
Make use of existing data
Every email, message, review, comment, and phone call you’ve ever received is valuable customer data. Many times this data gets ignored by businesses. Instead, companies put all their efforts into collecting new data via customer surveys and so on. Yet they never connect those results to the gold mine of data they already have.
Now, you have the right tool to analyze it all and gain a better understanding of your customers’ needs.
Businesses can learn a lot about their customers by analyzing their previous interactions. And while analyzing such large amounts of data seems overwhelming, statistical analysis can organize and interpret the data for you.
Allows your business to make decisions based on real data
Your ticket sales are dropping, and you’re not sure how to bring visitors back. You know you need to change your marketing approach, but how?
This is when you can conduct a statistical analysis on the data you’ve collected over the past few months, including customer reviews, surveys, and purchasing behaviors.
After analyzing this data, you will find the true reasons why guests are — or aren’t — choosing to visit your attraction. Statistical analysis will supply your business with the most accurate information available, allowing you to make informed future decisions.
Leverage machine learning and artificial intelligence
Statistical analysis uses machine learning and artificial intelligence techniques to interpret, organize, and analyze data for you.
In other words, your company will avoid making analytical mistakes since a computer is doing the work. With machine learning, you can teach the computer what to look for as it analyzes massive amounts of data for you.
This approach to data analysis allows your business to automate processes like collecting tons of reviews and emails and interpreting them in a way that makes sense for your team.
Free up your staff
It would take your staff days, if not weeks, to manually collect and analyze all of your customer data. Statistical analysis is a quicker, more efficient solution.
Your staff will then have more time to focus on more important aspects of your business, such as giving guests their full attention.
How can tours and attractions use this to improve their businesses?
An attraction might approach a statistical analysis with a hypothesis like “If I hire more staff, will guest satisfaction increase?” The next step would be a statistical analysis to collect customer data to test this theory.
Here are a few other ways an attraction can use statistical analysis to their benefit.
Better understand customer behavior
Are your guests spending money on food and gifts at your attraction? Have you noticed a slowdown in ticket sales? Are visitors downloading your app?
Statistical analysis can study all of the data available and help identify trends that would explain why your guests are behaving a certain way.
For example, you can use a statistical model to understand what guests are adding onto their ticket purchases. Perhaps you offer drink packages, gift cards, ticket bundles, or other upsells. An analysis on customer buying behavior will tell you what, if any, extra services or products guests are purchasing from you. You can then make decisions on what types of upsells you should continue offering to guests.
Identify what makes your customers tick
Statistical analysis can help your attraction pinpoint what areas of your customer experience have the greatest impact on your guests.
For example, you might find that a majority of your negative reviews online come from guests complaining about poor customer service during their visit.
You’ll then know that your current staff is not meeting your guests’ expectations. You can now decide whether it’s worth investing in customer service training for your existing staff or hire new employees altogether.
Predict future customer behaviors
Statistical analysis can make it easier to predict guest behavior. Predictive analysis, specifically, can be used to develop demand models that forecast sales and revenue.
Your attraction might use a predictive model to study past customer behavior during your peak season. This analysis can help you predict how many ticket sales you’ll make this year and how many people to expect at your venue. Then, you can make an informed decision about your staffing numbers for the upcoming high season.
Stand out from your competitors
Use your data to provide guests with the best experience possible and stand out from other attractions in your area.
Your competitors might not be leveraging the data they have available. Your attraction, on the other hand, can use statistical analysis to pin down customer preferences and exceed their expectations.
You can use sentiment analysis to study customer service calls, social media mentions, and online reviews. This kind of statistical analysis will tell you whether guest comments are negative, neutral, or positive, giving you a good idea of how they’re feeling about your brand.
This means you can spot negative sentiments right away and reach out to guests to find out what’s causing them to feel that way. Meanwhile, your competitors aren’t monitoring social mentions or performing the analysis necessary to spot problems in customer satisfaction.
Increase your revenue
One way data analysis helps you increase revenue is by improving your marketing strategy. Many times, an attraction will send a blanket marketing campaign to everyone on their contact list. They’re trying to reach as many people as possible in hopes of making more ticket sales.
Yet it’s not a very data-driven approach. Instead, your attraction can use cluster analysis to identify customers with similar attributes and segment your audience that way. You can create relevant marketing campaigns that appeal to each specific segment of guests.
The result is a highly personalized offer that’s tailored to that group’s preferences.
Forecast demand
Statistical analysis can also be used to forecast visitor demand. You can identify your low and peak seasons, and make marketing decisions accordingly.
This is a powerful metric to follow as it can inform major business decisions such as hiring, operational hours, marketing spend, and more.
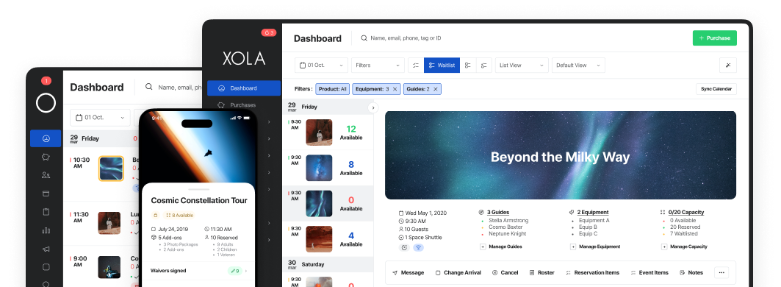
Xola’s capacity utilization report, for instance, gives you a detailed snapshot of your most popular tours, experiences, time slots, etc. Capacity utilization, also known as yield management, is the practice of managing available inventory slots and booking volume over a given time period.
For example, your attraction could pull this report to make staffing decisions about your busiest days and times of the year.
***
Out of all the ways your company can make marketing decisions, analyzing your customer data may bring the best possible outcome.
Your attraction can gain a lot from the data you already have. Instead of ignoring it, use this technique to improve your guest experience.


