Basic Tour Business Reporting
This is a step-by-step guide for anyone with the gumption to take on Excel. But don’t worry, I promise you won’t need to be a data wizard to follow along. We’re starting out simple: a few key formulas that will break down your tour’s booking, marketing, and operations data. If you’re looking for more advanced reporting, we have an article for you as well.
And in case you missed it, I’ve written a separate post explaining why these statistics matter and how you can interpret them to grow your tour company.
But for now, we’ll prepare basic statistics about your business’s booking channels: back office, online, mobile, and more.
Step 1: Export your bookings
First things first: Export your data from your booking software. If your reservation system gives you the option of exporting all your transactions or your booking orders, choose the latter.
For the purposes of this article, I’ll be providing reporting instructions based on Xola’s Excel export, though I realize yours may look different.
Open your report to the Orders tab. You should see Booking ID as the first column on the left. Before we make any calculations, we’ll want to establish some global filters for more accurate results.
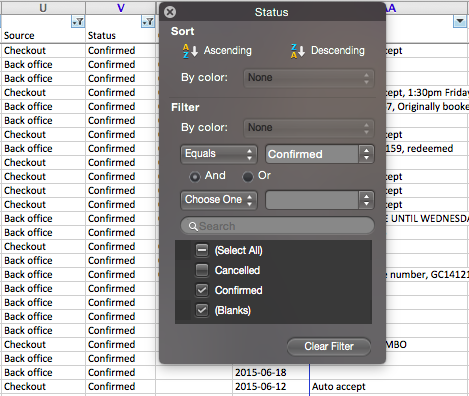
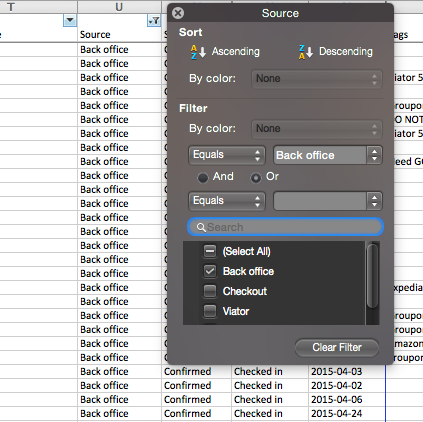
You may only want to analyze data relating to confirmed bookings. Here’s how you’ll exclude all any cancellations: Select Row 1 of your spreadsheet and apply a filter to all the columns. Now, single out the Status column. Click on the triangle in the top right of the Status cell. This will pop open a black box where you can see the different values represented in the column. Uncheck “Cancelled.” After applying a filter, the triangle will look more like a funnel.
Last thing: if you’d like to compare statistics for different tour listings, make sure you have your desired listings selected in the Experience column (second from the left).
Now you’re ready to proceed without having any of these later on:

Step 2: Booking analytics
As I mentioned in the introduction, the following booking statistics provide a comfortable introduction for beginners to Excel reporting. If you’d like to proceed to the more advanced marketing and operations reporting, head to Steps 3 & 4.
In this section, learn how to calculate:
- Your percentage of bookings by source (back office, online, mobile, etc.), both by volume and by value
- Your average booking value by source
- Your average number of guests per booking
Booking volumes and values by source
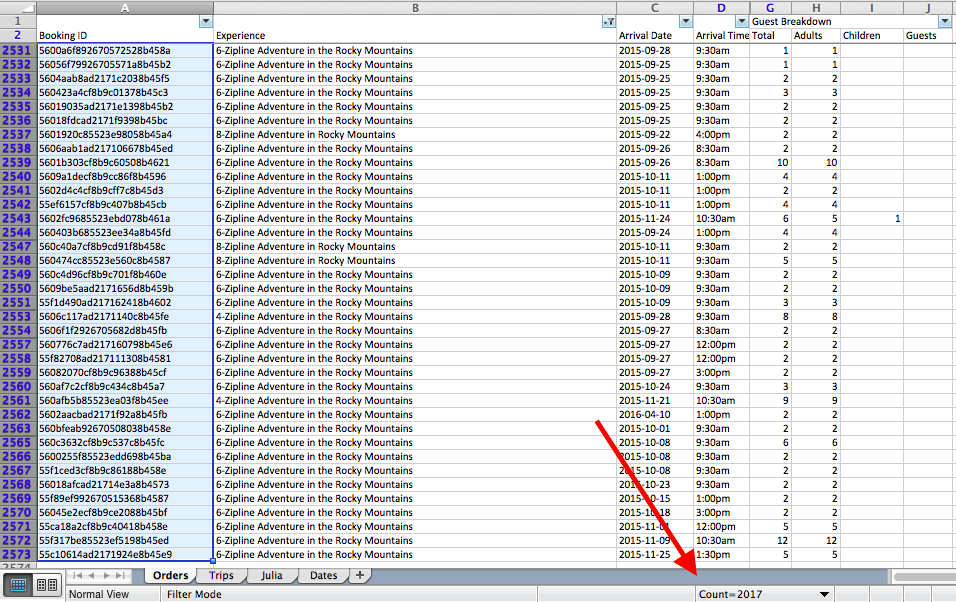
To get started, we’re going to want to know the total number of bookings. Make sure you have your global filters set (e.g. excluding cancelled bookings or certain listings) and then select the first cell below the Booking ID column. Hold command + shift + the down arrow to highlight the rest of the results in this column and tell Excel to count the results.
(Alternatively, you could simply click on the very top of the column to highlight all the results. But if your column title is in the selection, Excel will also include it since the Count function finds all the cells in the selection that contain content; “Booking ID” is one line of content. If you choose to count your results this way, therefore, simply subtract the number of rows included in the column titles. While Booking ID is only row of text, if you were to highlight all of Column G, for example, “Guest Breakdown” and “Total” would add two rows of text to your column count.)
In a separate sheet in Excel, begin making a table where you’ll keep track of all these computations.
Next, locate column G and highlight the results. Instead of counting the results, have Excel sum the column. You can switch shortcuts by clicking on the triangle next to the Count=2017 example in the picture above.
We want to keep track of the guest breakdown by source so we can find the average number of guests per booking across the different sources, which we’ll cover in more detail in just a bit.
Finally, head over to the Total Value column. You can calculate the total value of your bookings by summing all the cells in this column.
We’ll repeat this process for the different sources in your export to develop a booking breakdown by channel. Go to the Source column and begin by filtering for only Back office bookings. Keep moving through all the sources you’d like to analyze.
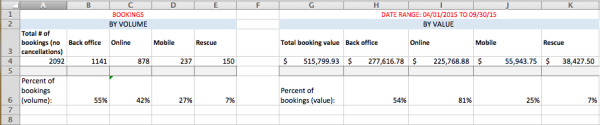
Once you’re done, the end result might look something like the table below. Feel free to spruce yours up as desired 🙂
Filtering Tags
By no means should your reporting stop at the Source level. With Xola’s advanced analytics, you can sort results by your booking tags as well. This is especially helpful when it comes to tracking mobile bookings.
Head over to the Tags column. (If yours is especially wide, I recommend formatting the column width to about 2 inches for easier navigation.) Once again, click on the triangle in the top right of the Tags cell. Instead of unchecking boxes like we did in the Source column, this time you’re going to type the desired keyword into the filter search bar.
Because Xola automatically tags any online booking made from a mobile device, you can easily calculate quantity and value of mobile bookings. Double check that your Source filter includes Checkout at this stage or you will not see any bookings tagged “mobile.” Jot down the total amount of mobile bookings and their corresponding value in your table.
Bonus Tag: Rescued Bookings
With Xola, you can automatically engage customers that have shown interest in booking your tour but did not complete the checkout. This is an incredibly effective feature that boosts your online conversion rates and your bottom line. You can see just how lucrative this little feature can be by filtering for bookings tagged “rescue.”
Follow the same steps you did with mobile, but in the case of rescued bookings, they can ultimately happen across any source, not just the checkout. For example, say a person abandons your checkout but is reengaged after your automatic nudge (via Xola). Whether she decides to complete the online checkout or call you up to book, that reservation will be marked with a Rescue tag.
Finding your booking and guest averages
With your stats recorded, you can establish your baseline averages in each of your chosen categories. You’ve conquered the heavy lifting, now a few simple formulas will do the rest.
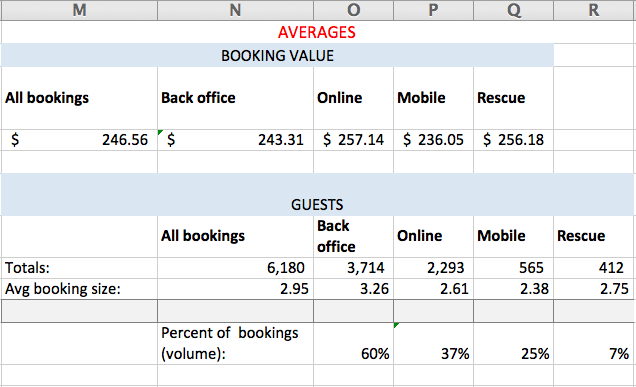
To find the average value of a booking by its source, divide the value of the source by the number of bookings it has. Based on my example table above, I’d get these results:
I recommend using formulas so that any changes in your data will automatically update these averages. Enter “=ColumnLetterRowNumber1/ColumnLetterRowNumber2”, where the numerator is the cell containing the total value of your bookings and the denominator is the cell containing the total number of bookings. You can apply the same principles to the formulas for Back office, Checkout, and Rescue booking value averages. For mobile, instead of dividing the total mobile booking value by the total number of bookings, I would use the number of Checkout bookings as my denominator, since a mobile booking by definition can only come through the online checkout.
Earlier I mentioned that we’d eventually rely on guest data. That time has come. You’ve been jotting down total guest counts for all your sources. To find the average booking size by source, divide the total number of guests per source by the number of bookings for that same source. E.g. Total number of guests / Total number of bookings; Number of back office guests / Number of back office bookings; etc.
Woohoo! At this point, you’ve mastered the basics of booking calculations. Now for our final steps in this advanced reporting lesson, we’ll see what we your export reveals about marketing and operational statistics. But for steps 3 and 4, we’re going to try something a little different…
Steps 3 & 4: Marketing and Operations
For these remaining categories, I’ve made a video screenshare walking you through the entire process! Right now, you’re a ninja at booking analytics. But the meat of this advanced reporting tutorial revolves around marketing and operational analytics.
In this section, learn how to calculate:
- Your revenue from add-ons
- Which add-ons are most popular (both in terms of volume and value)
- Coupon use and its revenue impacts
- The difference between your customers’ booking and arrival dates
https://youtu.be/VV8f4Y9mBHw
Advanced reporting for enterprise tour companies
For Finance managers or Accountants that need more advanced reporting, check out this article written for enterprise businesses.
Until then, happy crunching!
Oh and don’t forget about your Free Excel Template fully loaded with all the formulas and tables in this article! Download it here.